
Signal and Noise
- Page ID
- 283116

\( \newcommand{\vecs}[1]{\overset { \scriptstyle \rightharpoonup} {\mathbf{#1}} } \)
\( \newcommand{\vecd}[1]{\overset{-\!-\!\rightharpoonup}{\vphantom{a}\smash {#1}}} \)
\( \newcommand{\dsum}{\displaystyle\sum\limits} \)
\( \newcommand{\dint}{\displaystyle\int\limits} \)
\( \newcommand{\dlim}{\displaystyle\lim\limits} \)
\( \newcommand{\id}{\mathrm{id}}\) \( \newcommand{\Span}{\mathrm{span}}\)
( \newcommand{\kernel}{\mathrm{null}\,}\) \( \newcommand{\range}{\mathrm{range}\,}\)
\( \newcommand{\RealPart}{\mathrm{Re}}\) \( \newcommand{\ImaginaryPart}{\mathrm{Im}}\)
\( \newcommand{\Argument}{\mathrm{Arg}}\) \( \newcommand{\norm}[1]{\| #1 \|}\)
\( \newcommand{\inner}[2]{\langle #1, #2 \rangle}\)
\( \newcommand{\Span}{\mathrm{span}}\)
\( \newcommand{\id}{\mathrm{id}}\)
\( \newcommand{\Span}{\mathrm{span}}\)
\( \newcommand{\kernel}{\mathrm{null}\,}\)
\( \newcommand{\range}{\mathrm{range}\,}\)
\( \newcommand{\RealPart}{\mathrm{Re}}\)
\( \newcommand{\ImaginaryPart}{\mathrm{Im}}\)
\( \newcommand{\Argument}{\mathrm{Arg}}\)
\( \newcommand{\norm}[1]{\| #1 \|}\)
\( \newcommand{\inner}[2]{\langle #1, #2 \rangle}\)
\( \newcommand{\Span}{\mathrm{span}}\) \( \newcommand{\AA}{\unicode[.8,0]{x212B}}\)
\( \newcommand{\vectorA}[1]{\vec{#1}} % arrow\)
\( \newcommand{\vectorAt}[1]{\vec{\text{#1}}} % arrow\)
\( \newcommand{\vectorB}[1]{\overset { \scriptstyle \rightharpoonup} {\mathbf{#1}} } \)
\( \newcommand{\vectorC}[1]{\textbf{#1}} \)
\( \newcommand{\vectorD}[1]{\overrightarrow{#1}} \)
\( \newcommand{\vectorDt}[1]{\overrightarrow{\text{#1}}} \)
\( \newcommand{\vectE}[1]{\overset{-\!-\!\rightharpoonup}{\vphantom{a}\smash{\mathbf {#1}}}} \)
\( \newcommand{\vecs}[1]{\overset { \scriptstyle \rightharpoonup} {\mathbf{#1}} } \)
\(\newcommand{\longvect}{\overrightarrow}\)
\( \newcommand{\vecd}[1]{\overset{-\!-\!\rightharpoonup}{\vphantom{a}\smash {#1}}} \)
\(\newcommand{\avec}{\mathbf a}\) \(\newcommand{\bvec}{\mathbf b}\) \(\newcommand{\cvec}{\mathbf c}\) \(\newcommand{\dvec}{\mathbf d}\) \(\newcommand{\dtil}{\widetilde{\mathbf d}}\) \(\newcommand{\evec}{\mathbf e}\) \(\newcommand{\fvec}{\mathbf f}\) \(\newcommand{\nvec}{\mathbf n}\) \(\newcommand{\pvec}{\mathbf p}\) \(\newcommand{\qvec}{\mathbf q}\) \(\newcommand{\svec}{\mathbf s}\) \(\newcommand{\tvec}{\mathbf t}\) \(\newcommand{\uvec}{\mathbf u}\) \(\newcommand{\vvec}{\mathbf v}\) \(\newcommand{\wvec}{\mathbf w}\) \(\newcommand{\xvec}{\mathbf x}\) \(\newcommand{\yvec}{\mathbf y}\) \(\newcommand{\zvec}{\mathbf z}\) \(\newcommand{\rvec}{\mathbf r}\) \(\newcommand{\mvec}{\mathbf m}\) \(\newcommand{\zerovec}{\mathbf 0}\) \(\newcommand{\onevec}{\mathbf 1}\) \(\newcommand{\real}{\mathbb R}\) \(\newcommand{\twovec}[2]{\left[\begin{array}{r}#1 \\ #2 \end{array}\right]}\) \(\newcommand{\ctwovec}[2]{\left[\begin{array}{c}#1 \\ #2 \end{array}\right]}\) \(\newcommand{\threevec}[3]{\left[\begin{array}{r}#1 \\ #2 \\ #3 \end{array}\right]}\) \(\newcommand{\cthreevec}[3]{\left[\begin{array}{c}#1 \\ #2 \\ #3 \end{array}\right]}\) \(\newcommand{\fourvec}[4]{\left[\begin{array}{r}#1 \\ #2 \\ #3 \\ #4 \end{array}\right]}\) \(\newcommand{\cfourvec}[4]{\left[\begin{array}{c}#1 \\ #2 \\ #3 \\ #4 \end{array}\right]}\) \(\newcommand{\fivevec}[5]{\left[\begin{array}{r}#1 \\ #2 \\ #3 \\ #4 \\ #5 \\ \end{array}\right]}\) \(\newcommand{\cfivevec}[5]{\left[\begin{array}{c}#1 \\ #2 \\ #3 \\ #4 \\ #5 \\ \end{array}\right]}\) \(\newcommand{\mattwo}[4]{\left[\begin{array}{rr}#1 \amp #2 \\ #3 \amp #4 \\ \end{array}\right]}\) \(\newcommand{\laspan}[1]{\text{Span}\{#1\}}\) \(\newcommand{\bcal}{\cal B}\) \(\newcommand{\ccal}{\cal C}\) \(\newcommand{\scal}{\cal S}\) \(\newcommand{\wcal}{\cal W}\) \(\newcommand{\ecal}{\cal E}\) \(\newcommand{\coords}[2]{\left\{#1\right\}_{#2}}\) \(\newcommand{\gray}[1]{\color{gray}{#1}}\) \(\newcommand{\lgray}[1]{\color{lightgray}{#1}}\) \(\newcommand{\rank}{\operatorname{rank}}\) \(\newcommand{\row}{\text{Row}}\) \(\newcommand{\col}{\text{Col}}\) \(\renewcommand{\row}{\text{Row}}\) \(\newcommand{\nul}{\text{Nul}}\) \(\newcommand{\var}{\text{Var}}\) \(\newcommand{\corr}{\text{corr}}\) \(\newcommand{\len}[1]{\left|#1\right|}\) \(\newcommand{\bbar}{\overline{\bvec}}\) \(\newcommand{\bhat}{\widehat{\bvec}}\) \(\newcommand{\bperp}{\bvec^\perp}\) \(\newcommand{\xhat}{\widehat{\xvec}}\) \(\newcommand{\vhat}{\widehat{\vvec}}\) \(\newcommand{\uhat}{\widehat{\uvec}}\) \(\newcommand{\what}{\widehat{\wvec}}\) \(\newcommand{\Sighat}{\widehat{\Sigma}}\) \(\newcommand{\lt}{<}\) \(\newcommand{\gt}{>}\) \(\newcommand{\amp}{&}\) \(\definecolor{fillinmathshade}{gray}{0.9}\)Note
The LabVIEW run-time engine needs to be installed on the computer (Windows only), and can be obtained for free from here (user registration required, also free): http://www.ni.com/download/labview-run-time-engine-2010-sp1/2292/en/
Simulations themselves can be obtained here: https://sites.google.com/a/cord.edu/labview-for-analytical-chemistry/
Learning Objectives
Content Learning Objectives
After completing this activity, students will be able to:
- Differentiate between signals and noise in electronic measurements
- Describe the behavior of signals and noise in repeated measurements
- Describe signal-to-noise ratio and its impact on the ability to detect signals
Process Learning Objectives
After completing this activity, students will gain experience in:
- Interpreting and evaluating data (Information processing)
- Drawing and supporting conclusions with evidence (Critical thinking)
Required Prior Knowledge
- General familiarity with content in General Chemistry II and Quantitative Analysis
Open the Signal-to-Noise.exe file. Set the Signal level to 10.
- Click the right arrow button [⇨] repeatedly to refresh the display. Pick a spot on the horizontal axis, and describe how the intensity (vertical axis) at that point changes each time the display updates.
- As you refresh the display repeatedly, describe how the display as a whole changes.
- When we perform measurements, we are generally interested in measuring something that can be clearly distinguished. On what area in the display would your team focus? Briefly explain your reasoning.
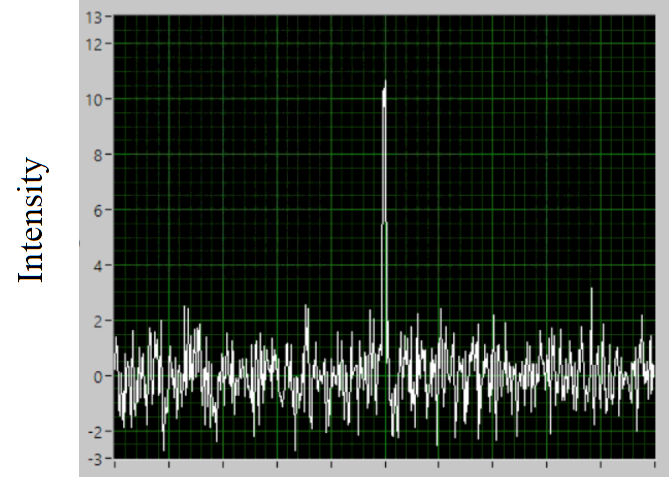
Electronic output from a device often looks like this and consists of two components:
- Signal, which is our desired output
- Noise, which can be generally characterized as an unwanted disturbance.
- Label the part(s) of the output in Model 1 that you consider to be the signal. Label the part(s) of the output in Model 1 that you consider to be noise.
Model 1
- Focus on the noise parts of the simulation. Describe how the size (amplitude) of the noise changes as the display is refreshed multiple times.
- Focus on the signal part of the simulation. Describe how the size (amplitude) of the signal changes as the display is refreshed multiple times.
- Change the signal level to 0, and refresh the display. Describe how the size (amplitude) of the noise and the signal changed.
- Increase the signal level from 0 to 1, and then observe the display as you refresh it several times. Continue increasing the signal level by 1, observing and refreshing the display several times after each increment. How does increasing the signal amplitude affect your ability to see the signal?
- We will define noise as the standard deviation of a set of repeated measurements. You can change the noise in the simulation by changing the “Backgnd Std Dev” value. Try increasing the noise and refresh the display. As the noise increases, how does that affect your ability to see the signal?
We will define the signal to noise (S/N) ratio:
\[\textit{S/N ratio} = \dfrac{\textit{Mean Signal Amplitude}}{\textit{Standard Deviation}}\nonumber\]
- As you increased the signal level in question 8, how did that change the S/N ratio?
- As you increased the noise (standard deviation) in question 9, how did that change the S/N ratio?
- Set the signal level to 0 and the Backgnd Std Dev to 1, and refresh the display. Notice that the simulation calculates the actual S/N ratio for your reference. Increase the signal level by 1 several times, making sure to refresh the display several times between each increment. At what minimum S/N ratio does the signal become clearly distinguishable from the noise?
- Is it favorable to have a large or a small S/N ratio? Briefly explain your reasoning.
- What are two general ways to improve the the S/N ratio?
- In chemical analyses, the signal amplitude is typically related to the concentration of the analyte of interest. Propose an explanation why increasing the signal amplitude can be difficult in some analyses.
- While it is desirable to maximize the signal amplitude in an analysis (within reason and instrumental limits), it is often infeasible or inconvenient to do so, especially when the signal amplitude is small. In general, what else can be done to improve the S/N ratio?
You will explore different methods available to deal with measurement noise in the next activity.
Application
- A student tells your team that when the signal level is 5, the signal area of the display will be equal to 5. Predict whether or not the student is correct, and briefly explain your team’s reasoning.
- Set the signal level to 5, and refresh the display several times. Was your prediction in the previous question correct? Describe how the display does or does not support your prediction from the previous question.
- Revisit your description of the signal in question 6. Use your findings from the previous question and question 5 to propose an explanation for the behavior of the signal amplitude seen on the display.
Contributors and Attributions
- An-Phong Le, Florida Southern University (ale@flsouthern.edu)
- Sourced from the Analytical Sciences Digital Library