
Signal Averaging
- Page ID
- 283117

\( \newcommand{\vecs}[1]{\overset { \scriptstyle \rightharpoonup} {\mathbf{#1}} } \)
\( \newcommand{\vecd}[1]{\overset{-\!-\!\rightharpoonup}{\vphantom{a}\smash {#1}}} \)
\( \newcommand{\id}{\mathrm{id}}\) \( \newcommand{\Span}{\mathrm{span}}\)
( \newcommand{\kernel}{\mathrm{null}\,}\) \( \newcommand{\range}{\mathrm{range}\,}\)
\( \newcommand{\RealPart}{\mathrm{Re}}\) \( \newcommand{\ImaginaryPart}{\mathrm{Im}}\)
\( \newcommand{\Argument}{\mathrm{Arg}}\) \( \newcommand{\norm}[1]{\| #1 \|}\)
\( \newcommand{\inner}[2]{\langle #1, #2 \rangle}\)
\( \newcommand{\Span}{\mathrm{span}}\)
\( \newcommand{\id}{\mathrm{id}}\)
\( \newcommand{\Span}{\mathrm{span}}\)
\( \newcommand{\kernel}{\mathrm{null}\,}\)
\( \newcommand{\range}{\mathrm{range}\,}\)
\( \newcommand{\RealPart}{\mathrm{Re}}\)
\( \newcommand{\ImaginaryPart}{\mathrm{Im}}\)
\( \newcommand{\Argument}{\mathrm{Arg}}\)
\( \newcommand{\norm}[1]{\| #1 \|}\)
\( \newcommand{\inner}[2]{\langle #1, #2 \rangle}\)
\( \newcommand{\Span}{\mathrm{span}}\) \( \newcommand{\AA}{\unicode[.8,0]{x212B}}\)
\( \newcommand{\vectorA}[1]{\vec{#1}} % arrow\)
\( \newcommand{\vectorAt}[1]{\vec{\text{#1}}} % arrow\)
\( \newcommand{\vectorB}[1]{\overset { \scriptstyle \rightharpoonup} {\mathbf{#1}} } \)
\( \newcommand{\vectorC}[1]{\textbf{#1}} \)
\( \newcommand{\vectorD}[1]{\overrightarrow{#1}} \)
\(\newcommand{\ket}[1]{\left| #1 \right>} \)
\( \newcommand{\bra}[1]{\left< #1 \right|} \)
\( \newcommand{\braket}[2]{\left< #1 \vphantom{#2} \right| \left. #2 \vphantom{#1} \right>} \)
\( \newcommand{\qmvec}[1]{\mathbf{\vec{#1}}} \)
\( \newcommand{\op}[1]{\hat{\mathbf{#1}}}\)
\( \newcommand{\expect}[1]{\langle #1 \rangle}\)
\( \newcommand{\vectorDt}[1]{\overrightarrow{\text{#1}}} \)
\( \newcommand{\vectE}[1]{\overset{-\!-\!\rightharpoonup}{\vphantom{a}\smash{\mathbf {#1}}}} \)
\( \newcommand{\vecs}[1]{\overset { \scriptstyle \rightharpoonup} {\mathbf{#1}} } \)
\( \newcommand{\vecd}[1]{\overset{-\!-\!\rightharpoonup}{\vphantom{a}\smash {#1}}} \)
\(\newcommand{\avec}{\mathbf a}\) \(\newcommand{\bvec}{\mathbf b}\) \(\newcommand{\cvec}{\mathbf c}\) \(\newcommand{\dvec}{\mathbf d}\) \(\newcommand{\dtil}{\widetilde{\mathbf d}}\) \(\newcommand{\evec}{\mathbf e}\) \(\newcommand{\fvec}{\mathbf f}\) \(\newcommand{\nvec}{\mathbf n}\) \(\newcommand{\pvec}{\mathbf p}\) \(\newcommand{\qvec}{\mathbf q}\) \(\newcommand{\svec}{\mathbf s}\) \(\newcommand{\tvec}{\mathbf t}\) \(\newcommand{\uvec}{\mathbf u}\) \(\newcommand{\vvec}{\mathbf v}\) \(\newcommand{\wvec}{\mathbf w}\) \(\newcommand{\xvec}{\mathbf x}\) \(\newcommand{\yvec}{\mathbf y}\) \(\newcommand{\zvec}{\mathbf z}\) \(\newcommand{\rvec}{\mathbf r}\) \(\newcommand{\mvec}{\mathbf m}\) \(\newcommand{\zerovec}{\mathbf 0}\) \(\newcommand{\onevec}{\mathbf 1}\) \(\newcommand{\real}{\mathbb R}\) \(\newcommand{\twovec}[2]{\left[\begin{array}{r}#1 \\ #2 \end{array}\right]}\) \(\newcommand{\ctwovec}[2]{\left[\begin{array}{c}#1 \\ #2 \end{array}\right]}\) \(\newcommand{\threevec}[3]{\left[\begin{array}{r}#1 \\ #2 \\ #3 \end{array}\right]}\) \(\newcommand{\cthreevec}[3]{\left[\begin{array}{c}#1 \\ #2 \\ #3 \end{array}\right]}\) \(\newcommand{\fourvec}[4]{\left[\begin{array}{r}#1 \\ #2 \\ #3 \\ #4 \end{array}\right]}\) \(\newcommand{\cfourvec}[4]{\left[\begin{array}{c}#1 \\ #2 \\ #3 \\ #4 \end{array}\right]}\) \(\newcommand{\fivevec}[5]{\left[\begin{array}{r}#1 \\ #2 \\ #3 \\ #4 \\ #5 \\ \end{array}\right]}\) \(\newcommand{\cfivevec}[5]{\left[\begin{array}{c}#1 \\ #2 \\ #3 \\ #4 \\ #5 \\ \end{array}\right]}\) \(\newcommand{\mattwo}[4]{\left[\begin{array}{rr}#1 \amp #2 \\ #3 \amp #4 \\ \end{array}\right]}\) \(\newcommand{\laspan}[1]{\text{Span}\{#1\}}\) \(\newcommand{\bcal}{\cal B}\) \(\newcommand{\ccal}{\cal C}\) \(\newcommand{\scal}{\cal S}\) \(\newcommand{\wcal}{\cal W}\) \(\newcommand{\ecal}{\cal E}\) \(\newcommand{\coords}[2]{\left\{#1\right\}_{#2}}\) \(\newcommand{\gray}[1]{\color{gray}{#1}}\) \(\newcommand{\lgray}[1]{\color{lightgray}{#1}}\) \(\newcommand{\rank}{\operatorname{rank}}\) \(\newcommand{\row}{\text{Row}}\) \(\newcommand{\col}{\text{Col}}\) \(\renewcommand{\row}{\text{Row}}\) \(\newcommand{\nul}{\text{Nul}}\) \(\newcommand{\var}{\text{Var}}\) \(\newcommand{\corr}{\text{corr}}\) \(\newcommand{\len}[1]{\left|#1\right|}\) \(\newcommand{\bbar}{\overline{\bvec}}\) \(\newcommand{\bhat}{\widehat{\bvec}}\) \(\newcommand{\bperp}{\bvec^\perp}\) \(\newcommand{\xhat}{\widehat{\xvec}}\) \(\newcommand{\vhat}{\widehat{\vvec}}\) \(\newcommand{\uhat}{\widehat{\uvec}}\) \(\newcommand{\what}{\widehat{\wvec}}\) \(\newcommand{\Sighat}{\widehat{\Sigma}}\) \(\newcommand{\lt}{<}\) \(\newcommand{\gt}{>}\) \(\newcommand{\amp}{&}\) \(\definecolor{fillinmathshade}{gray}{0.9}\)Note
The LabVIEW run-time engine needs to be installed on the computer (Windows only), and can be obtained for free from here (user registration required, also free): http://www.ni.com/download/labview-run-time-engine-2010-sp1/2292/en/
Simulations themselves can be obtained here: https://sites.google.com/a/cord.edu/labview-for-analytical-chemistry/
Boxcar Averaging
Run the application called BoxcarAveraging.exe
- The data is the result of a combination of a signal (regularly repeating sine wave) and noise. On the diagram below, point out where the signal is and where the noise is.
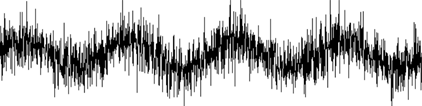
- Is the noise always positive or negative? Does the noise always have the same value?
- Use the up/down arrows next to the Number of Points to Average and make note of what you see.
- What happens to the appearance of the averaged data as the number of points to average increases?
- Describe how boxcar averaging works and explain specifically how it helps to increase the S/N ratio. (Your textbook or resources on the internet will be helpful here.)
- This method (along with rolling averages) are often referred to as smoothing techniques. Explain why this name is appropriate.
- At what boxcar size (number of points to average) does the averaged signal begin to lose the overall shape of the raw data? Propose an explanation for why this happens.
- Sketch what the raw data would look like if the frequency of the signal (not the noise, but the underlying sine wave) increased while the noise remained unchanged. How would your answer to the previous question change in this case? Explain your reasoning.
Ensemble Averaging
Run the application called EnsembleAveraging.exe and set the number of scans to average to 4, the time between scans to 5.00 seconds, and the signal level to 4.
- Run the simulation, and observe the S/N ratio for the current scan as well as the shape of the data displayed. As each scan is displayed, how does the current scan S/N change, and how is this reflected in the data displayed?
- Run the simulation again, and observe the Overall S/N in the Average of All Scans panel as well as the shape of the average data displayed. As each scan is added, how does the Overall S/N change, and how is this reflected in the Average of All Scans data displayed?
- Describe how Ensemble Averaging works and explain why it helps to increase the S/N ratio. (Your textbook or resources on the internet will be helpful here.)
- Set the number of scans to average to 10000, the signal level to 4, and the time between scans to 0.1 seconds. Run the simulation, and stop it when the Overall S/N reaches 40. How many scans (n, displayed in the Current Scan panel) does it take to reach an Overall S/N of 40? Repeat this three times and report your values.
- Restart the simulation, and stop it when the Overall S/N ratio reaches 80. How many scans does it take to reach an Overall S/N of 80? Repeat this three times and report your values.
- Compare your answers to questions 11 and 12 – based on your average results, by what factor does the number of scans have to change in order to double the Overall S/N ratio?
- Examine the graph in the lower right panel. Explain what this graph is displaying.
- Describe the rough shape of the graph displayed. Use your answer from question 13 to explain the significance of what is plotted on the x-axis in this panel.
- If you want to increase the Overall S/N ratio of a measurement by a factor of 10, by what factor do the number of scans averaged need to increase?
- Both boxcar averaging and ensemble averaging are used to increase the S/N ratio of a measurement. What advantages and disadvantages are there for each method? Support your answer using your results and observations from these simulations.
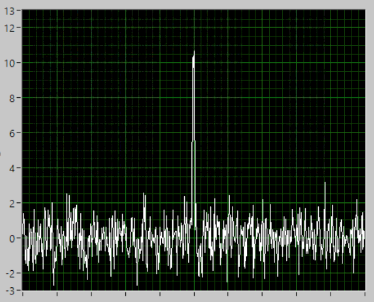
- Consider the data displayed below. To increase the S/N ratio of this measurement, would it be more appropriate to use boxcar averaging or ensemble averaging? Explain your reasoning.
Contributors and Attributions
- An-Phong Le, Florida Southern University (ale@flsouthern.edu)
- Sourced from the Analytical Sciences Digital Library