
Normal Distribution and Statistics
- Page ID
- 279680

\( \newcommand{\vecs}[1]{\overset { \scriptstyle \rightharpoonup} {\mathbf{#1}} } \)
\( \newcommand{\vecd}[1]{\overset{-\!-\!\rightharpoonup}{\vphantom{a}\smash {#1}}} \)
\( \newcommand{\dsum}{\displaystyle\sum\limits} \)
\( \newcommand{\dint}{\displaystyle\int\limits} \)
\( \newcommand{\dlim}{\displaystyle\lim\limits} \)
\( \newcommand{\id}{\mathrm{id}}\) \( \newcommand{\Span}{\mathrm{span}}\)
( \newcommand{\kernel}{\mathrm{null}\,}\) \( \newcommand{\range}{\mathrm{range}\,}\)
\( \newcommand{\RealPart}{\mathrm{Re}}\) \( \newcommand{\ImaginaryPart}{\mathrm{Im}}\)
\( \newcommand{\Argument}{\mathrm{Arg}}\) \( \newcommand{\norm}[1]{\| #1 \|}\)
\( \newcommand{\inner}[2]{\langle #1, #2 \rangle}\)
\( \newcommand{\Span}{\mathrm{span}}\)
\( \newcommand{\id}{\mathrm{id}}\)
\( \newcommand{\Span}{\mathrm{span}}\)
\( \newcommand{\kernel}{\mathrm{null}\,}\)
\( \newcommand{\range}{\mathrm{range}\,}\)
\( \newcommand{\RealPart}{\mathrm{Re}}\)
\( \newcommand{\ImaginaryPart}{\mathrm{Im}}\)
\( \newcommand{\Argument}{\mathrm{Arg}}\)
\( \newcommand{\norm}[1]{\| #1 \|}\)
\( \newcommand{\inner}[2]{\langle #1, #2 \rangle}\)
\( \newcommand{\Span}{\mathrm{span}}\) \( \newcommand{\AA}{\unicode[.8,0]{x212B}}\)
\( \newcommand{\vectorA}[1]{\vec{#1}} % arrow\)
\( \newcommand{\vectorAt}[1]{\vec{\text{#1}}} % arrow\)
\( \newcommand{\vectorB}[1]{\overset { \scriptstyle \rightharpoonup} {\mathbf{#1}} } \)
\( \newcommand{\vectorC}[1]{\textbf{#1}} \)
\( \newcommand{\vectorD}[1]{\overrightarrow{#1}} \)
\( \newcommand{\vectorDt}[1]{\overrightarrow{\text{#1}}} \)
\( \newcommand{\vectE}[1]{\overset{-\!-\!\rightharpoonup}{\vphantom{a}\smash{\mathbf {#1}}}} \)
\( \newcommand{\vecs}[1]{\overset { \scriptstyle \rightharpoonup} {\mathbf{#1}} } \)
\(\newcommand{\longvect}{\overrightarrow}\)
\( \newcommand{\vecd}[1]{\overset{-\!-\!\rightharpoonup}{\vphantom{a}\smash {#1}}} \)
\(\newcommand{\avec}{\mathbf a}\) \(\newcommand{\bvec}{\mathbf b}\) \(\newcommand{\cvec}{\mathbf c}\) \(\newcommand{\dvec}{\mathbf d}\) \(\newcommand{\dtil}{\widetilde{\mathbf d}}\) \(\newcommand{\evec}{\mathbf e}\) \(\newcommand{\fvec}{\mathbf f}\) \(\newcommand{\nvec}{\mathbf n}\) \(\newcommand{\pvec}{\mathbf p}\) \(\newcommand{\qvec}{\mathbf q}\) \(\newcommand{\svec}{\mathbf s}\) \(\newcommand{\tvec}{\mathbf t}\) \(\newcommand{\uvec}{\mathbf u}\) \(\newcommand{\vvec}{\mathbf v}\) \(\newcommand{\wvec}{\mathbf w}\) \(\newcommand{\xvec}{\mathbf x}\) \(\newcommand{\yvec}{\mathbf y}\) \(\newcommand{\zvec}{\mathbf z}\) \(\newcommand{\rvec}{\mathbf r}\) \(\newcommand{\mvec}{\mathbf m}\) \(\newcommand{\zerovec}{\mathbf 0}\) \(\newcommand{\onevec}{\mathbf 1}\) \(\newcommand{\real}{\mathbb R}\) \(\newcommand{\twovec}[2]{\left[\begin{array}{r}#1 \\ #2 \end{array}\right]}\) \(\newcommand{\ctwovec}[2]{\left[\begin{array}{c}#1 \\ #2 \end{array}\right]}\) \(\newcommand{\threevec}[3]{\left[\begin{array}{r}#1 \\ #2 \\ #3 \end{array}\right]}\) \(\newcommand{\cthreevec}[3]{\left[\begin{array}{c}#1 \\ #2 \\ #3 \end{array}\right]}\) \(\newcommand{\fourvec}[4]{\left[\begin{array}{r}#1 \\ #2 \\ #3 \\ #4 \end{array}\right]}\) \(\newcommand{\cfourvec}[4]{\left[\begin{array}{c}#1 \\ #2 \\ #3 \\ #4 \end{array}\right]}\) \(\newcommand{\fivevec}[5]{\left[\begin{array}{r}#1 \\ #2 \\ #3 \\ #4 \\ #5 \\ \end{array}\right]}\) \(\newcommand{\cfivevec}[5]{\left[\begin{array}{c}#1 \\ #2 \\ #3 \\ #4 \\ #5 \\ \end{array}\right]}\) \(\newcommand{\mattwo}[4]{\left[\begin{array}{rr}#1 \amp #2 \\ #3 \amp #4 \\ \end{array}\right]}\) \(\newcommand{\laspan}[1]{\text{Span}\{#1\}}\) \(\newcommand{\bcal}{\cal B}\) \(\newcommand{\ccal}{\cal C}\) \(\newcommand{\scal}{\cal S}\) \(\newcommand{\wcal}{\cal W}\) \(\newcommand{\ecal}{\cal E}\) \(\newcommand{\coords}[2]{\left\{#1\right\}_{#2}}\) \(\newcommand{\gray}[1]{\color{gray}{#1}}\) \(\newcommand{\lgray}[1]{\color{lightgray}{#1}}\) \(\newcommand{\rank}{\operatorname{rank}}\) \(\newcommand{\row}{\text{Row}}\) \(\newcommand{\col}{\text{Col}}\) \(\renewcommand{\row}{\text{Row}}\) \(\newcommand{\nul}{\text{Nul}}\) \(\newcommand{\var}{\text{Var}}\) \(\newcommand{\corr}{\text{corr}}\) \(\newcommand{\len}[1]{\left|#1\right|}\) \(\newcommand{\bbar}{\overline{\bvec}}\) \(\newcommand{\bhat}{\widehat{\bvec}}\) \(\newcommand{\bperp}{\bvec^\perp}\) \(\newcommand{\xhat}{\widehat{\xvec}}\) \(\newcommand{\vhat}{\widehat{\vvec}}\) \(\newcommand{\uhat}{\widehat{\uvec}}\) \(\newcommand{\what}{\widehat{\wvec}}\) \(\newcommand{\Sighat}{\widehat{\Sigma}}\) \(\newcommand{\lt}{<}\) \(\newcommand{\gt}{>}\) \(\newcommand{\amp}{&}\) \(\definecolor{fillinmathshade}{gray}{0.9}\)Classroom Exercise #5: Normal Distribution and Statistics
There is an Excel spreadsheet and instructions at the end of this document. You will need to use your computer to do the statistics to complete the questions.
- Is my red blood cell count high today?
The excel sheet gives normal readings of red blood cell counts (all are *106 cells)
Calculate the mean and standard deviation.
Today my red blood count is 5.6*106? How certain (statistically) are you that value is abnormally high? Use the normal distribution function to figure it out.
- Pre and Post test.
The second Excel sheet has test scores for some students before and after they took a course. Compute the mean, standard deviation, and 95% confidence interval for each group. Do the confidence intervals overlap?
Compute the t-test if the results are not paired. Is the result statistically different at the 95% confidence level?
Compute the t-test if the results were paired (i.e. each row represents the same students). What is the statistical advantage of performing the paired t-test?
- Absorbance dependence on two different ions.
- The excel spreadsheet gives UV-Vis absorbance data for absorbance of mixtures of NO3 and S2O4 ions. Using ANOVA, which ions does the absorbance depends on? How did you reach that conclusion?
- Look at the data yourself. Are you surprised by the statistical results? Does the absorbance seem to be linearly dependent on both variables?
- The excel spreadsheet gives UV-Vis absorbance data for absorbance of mixtures of NO3 and S2O4 ions. Using ANOVA, which ions does the absorbance depends on? How did you reach that conclusion?
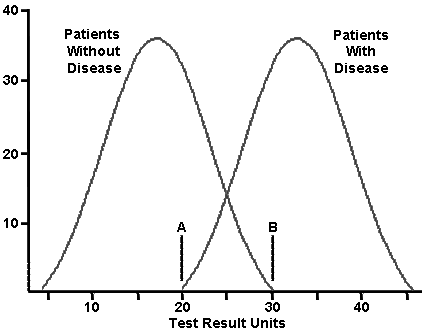
- Look at the following overlapping distributions for patients with and without a disease. The y axis is number of patients. The mean for the patients without disease is 17 units, with a standard deviation of 5.5. The mean of the patients with disease is 33 units, with a standard deviation of 5.5.
Data from: https://library.med.utah.edu/WebPath.../BIOSTATS.html
-
If point A is used as the cut off for disease, what percentage of healthy patients will have a false positive?
- If point B is used as the cut-off for disease, what percentage of diseased patients will have a false negative?
- If you used 25 instead as the cut-off, how many false positives and false negatives would you expect?
- You could label point A and point B with the labels, point of maximum sensitivity and point of maximum selectivity. Explain which point would have each label. Discuss the trade-offs in choosing a testing point with overlapping distributions.
-
Excel Syntax
CONFIDENCE.NORM(alpha,standard_dev,size)
The CONFIDENCE.NORM function syntax has the following arguments:
- Alpha Required. The significance level used to compute the confidence level. The confidence level equals 100*(1 - alpha)%, or in other words, an alpha of 0.05 indicates a 95 percent confidence level.
- Standard_dev Required. The population standard deviation for the data range and is assumed to be known.
- Size Required. The sample size.
NORM.DIST(x,mean,standard_dev,cumulative)
The NORM.DIST function syntax has the following arguments:
- X Required. The value for which you want the distribution.
- Mean Required. The arithmetic mean of the distribution.
- Standard_dev Required. The standard deviation of the distribution.
- Cumulative Required. A logical value that determines the form of the function. If cumulative is TRUE, NORM.DIST returns the cumulative distribution function; if FALSE, it returns the probability mass function.
Notes: When cumulative is true, it gives the area under the curve from –infinity until that value.
AVERAGE(number1, [number2], ...)
STDEV.S(number1,[number2],...)
Gives the sample standard deviation
STDEV.P(number1,[number2],...)
Gives the population standard deviation
T.TEST(array1,array2,tails,type)
Gives a t test
- Array 1: First range of values to compare
- Array 2: Second range of values to compare
- Tails: Either 1 or 2. Generally you do 2 tails, unless you know your values cannot vary in one direction (then it is one tail)
- Type: 1=Paired, 2=Unpaired (note for Paired, the arrays must have the same number of data points)
For ANOVA:
Hit data analysis (under data):
Choose it off the menu. If you have 1 variable, it is a 1 way ANOVA. If you have 2 variables, it is a 2-way ANOVA. If the data are paired (i.e. from the same sample) there is a repeated measures test, if not choose without replication.
Example steps for ANOVA
Similar for 2-way without replication, just choose that instead if you have 2 variables.
Note
You must have the analysis tool-pak installed. Go to File, options, and add-ins. If you click Manage Add-ins at the bottom, you can install the analysis tool-pak. Then the rest of these instructions will work.
To perform a single factor ANOVA, execute the following steps.
- On the Data tab, click Data Analysis.
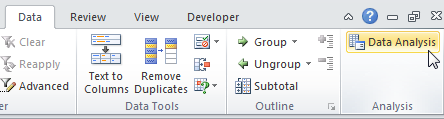
Note: can't find the Data Analysis button? Click here to load the Analysis ToolPak add-in.
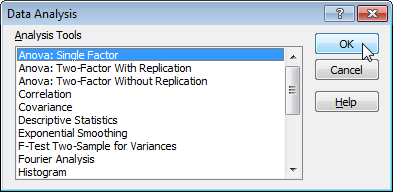
- Select Anova: Single Factor and click OK.
- Click in the Input Range box and select the range A2:C10.
- Click in the Output Range box and select cell E1.
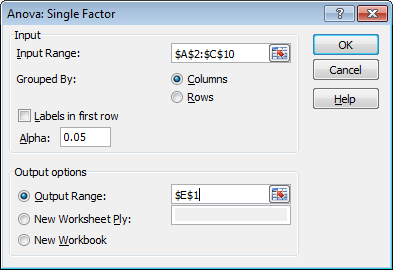
- Click OK.
Result:

Conclusion: if F > F crit, we reject the null hypothesis. This is the case, 15.196 > 3.443. Therefore, we reject the null hypothesis. The means of the three populations are not all equal. At least one of the means is different. However, the ANOVA does not tell you where the difference lies. You need other post-hoc comparison tests for that.
Data
Contributors and Attributions
- Jill Venton, University of Virginia (bjv2n@eservices.virginia.edu)