
Comparing Spectroscopic Techniques
- Page ID
- 295969

\( \newcommand{\vecs}[1]{\overset { \scriptstyle \rightharpoonup} {\mathbf{#1}} } \)
\( \newcommand{\vecd}[1]{\overset{-\!-\!\rightharpoonup}{\vphantom{a}\smash {#1}}} \)
\( \newcommand{\id}{\mathrm{id}}\) \( \newcommand{\Span}{\mathrm{span}}\)
( \newcommand{\kernel}{\mathrm{null}\,}\) \( \newcommand{\range}{\mathrm{range}\,}\)
\( \newcommand{\RealPart}{\mathrm{Re}}\) \( \newcommand{\ImaginaryPart}{\mathrm{Im}}\)
\( \newcommand{\Argument}{\mathrm{Arg}}\) \( \newcommand{\norm}[1]{\| #1 \|}\)
\( \newcommand{\inner}[2]{\langle #1, #2 \rangle}\)
\( \newcommand{\Span}{\mathrm{span}}\)
\( \newcommand{\id}{\mathrm{id}}\)
\( \newcommand{\Span}{\mathrm{span}}\)
\( \newcommand{\kernel}{\mathrm{null}\,}\)
\( \newcommand{\range}{\mathrm{range}\,}\)
\( \newcommand{\RealPart}{\mathrm{Re}}\)
\( \newcommand{\ImaginaryPart}{\mathrm{Im}}\)
\( \newcommand{\Argument}{\mathrm{Arg}}\)
\( \newcommand{\norm}[1]{\| #1 \|}\)
\( \newcommand{\inner}[2]{\langle #1, #2 \rangle}\)
\( \newcommand{\Span}{\mathrm{span}}\) \( \newcommand{\AA}{\unicode[.8,0]{x212B}}\)
\( \newcommand{\vectorA}[1]{\vec{#1}} % arrow\)
\( \newcommand{\vectorAt}[1]{\vec{\text{#1}}} % arrow\)
\( \newcommand{\vectorB}[1]{\overset { \scriptstyle \rightharpoonup} {\mathbf{#1}} } \)
\( \newcommand{\vectorC}[1]{\textbf{#1}} \)
\( \newcommand{\vectorD}[1]{\overrightarrow{#1}} \)
\( \newcommand{\vectorDt}[1]{\overrightarrow{\text{#1}}} \)
\( \newcommand{\vectE}[1]{\overset{-\!-\!\rightharpoonup}{\vphantom{a}\smash{\mathbf {#1}}}} \)
\( \newcommand{\vecs}[1]{\overset { \scriptstyle \rightharpoonup} {\mathbf{#1}} } \)
\( \newcommand{\vecd}[1]{\overset{-\!-\!\rightharpoonup}{\vphantom{a}\smash {#1}}} \)
- Explain molecular origins and fundamental equations of spectroscopy. And illustrate energy diagrams for spectroscopic techniques (UV-Vis, FL, AA).
- The image below illustrates the Electromagnetic Spectrum.
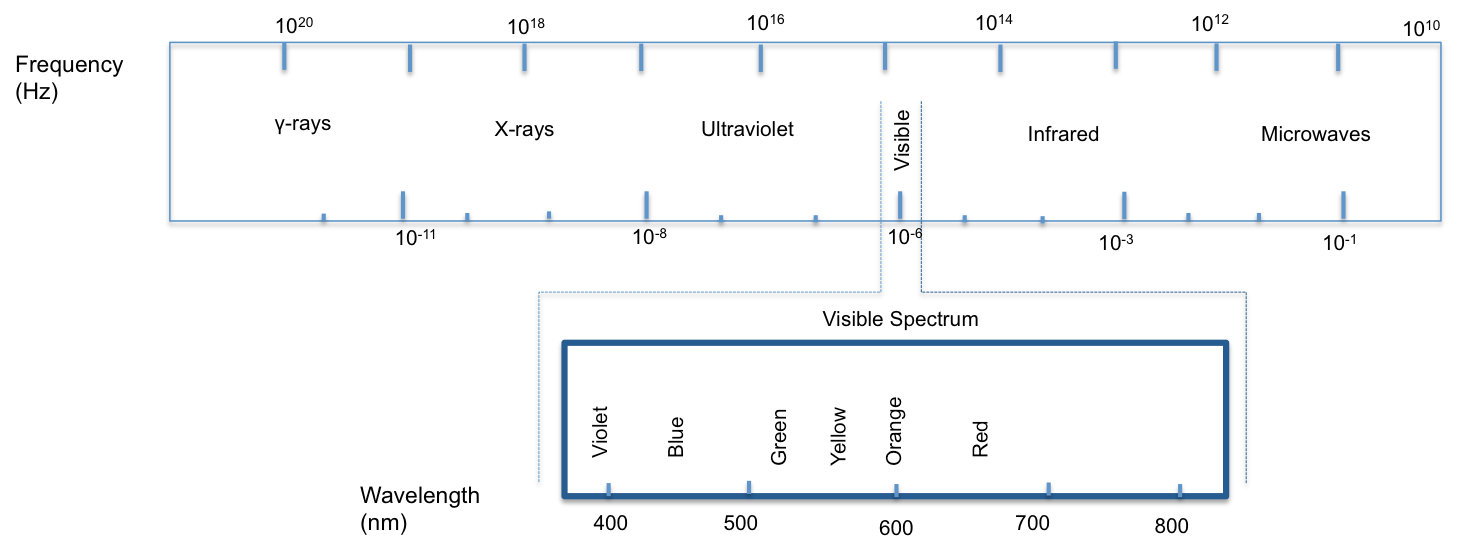
What is the relationship between the energy, frequency, & wavelength of electromagnetic radiation?
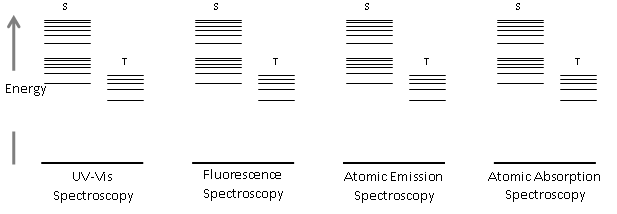
- Draw energy diagrams (Jablonski diagrams) for the techniques listed. Indicated ABSORPTION, FLUORESCENCE, or PHOPHORESCENCE energy transitions as needed. Use appropriate arrow notation (straight line = radiative process, wavy line = non-radiative process).
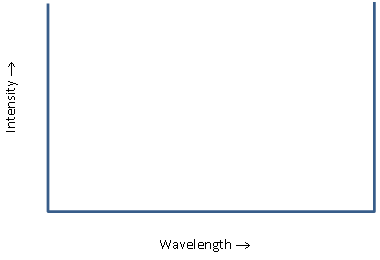
- On one chart, crudely sketch both an excitation (EX) spectrum and an emission (EM) spectrum for the same fluorescing molecule.
- What factors influence the absorbance that you would measure for a sample? Is each factor directly or inversely proportional to the absorbance? Hint: Beer’s Law
- The image below illustrates the Electromagnetic Spectrum.
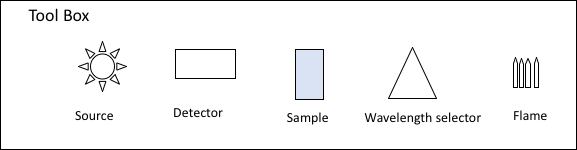
- Sketch instrumental schematics for each spectrophotometer (UV-Vis, FL, AA).
- On your white board, draw a simple block diagram for each type of spectrometer (UV-Vis, FL, AA) outlined below. Each block diagram should include sources, wavelength selectors, detectors, sample and path of radiation. Use the tool box for help.
- Instrument disassembly/analysis of a UV-Vis. The parts listed below will be addressed.
- slit width
- filters
- Concave mirrors
- monochromator
- Beam splitter
- two detectors
- Sample holder
- Double beam Spec difference
- UV-Vis vs. Fluorometer
- Length of spec
- Black interior
- Analysis of unknown samples A, B, & C using UV-Vis, FL, AA.
- Scan all three samples in each of the instruments and note if spectra appears, to what extent, and at what wavelength.
Sample
A
B
C
UV-Vis
Peak Present:
λ max =
Peak Shape:
Peak Present:
λ max =
Peak Shape:
Peak Present:
λ max =
Peak Shape:
FL
λ Ex =
λ Em =
Peak Intensity
λ Ex =
λ Em =
Peak Intensity
λ Ex =
λ Em =
Peak Intensity
AA
λ Abs =
Absorption: Yes |No
λ Abs =
Absorption: Yes |No
λ Abs =
Absorption: Yes |No
- Three possible identities for the unknown compounds are listed below. Identify which one of them would be compound A, B, and C.
Caffeine 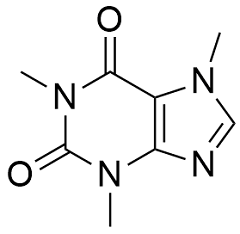
Pyrene 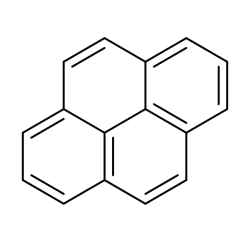
Copper nitrate 
- Scan all three samples in each of the instruments and note if spectra appears, to what extent, and at what wavelength.
- Interrogate compound classification using three spectroscopic techniques (UV-Vis, FL, AA) and select appropriate technique.
- Which technique would be optimal for analysis of the following compounds? Justify your answers.
Mn(acac)3 3.png?revision=1)
Pyridine 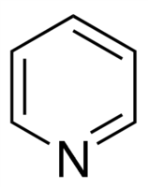
Cobalt ion 
Anthracene 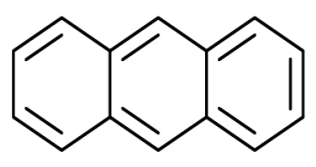
Cobalt hexahydrate 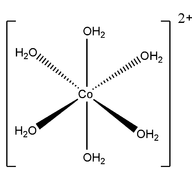
Butane 
- Which sample types can be analyzed using each technique? (UV-Vis, FL, AA)
- Which technique would be optimal for analysis of the following compounds? Justify your answers.
Contributors and Attributions
- Jennifer Monahan and Asmira Alagic, Saint Louis University (jmonaha1@slu.edu, alagic@slu.edu)
- Sourced from the Analytical Sciences Digital Library