
Direct Calibration
- Page ID
- 280720

\( \newcommand{\vecs}[1]{\overset { \scriptstyle \rightharpoonup} {\mathbf{#1}} } \)
\( \newcommand{\vecd}[1]{\overset{-\!-\!\rightharpoonup}{\vphantom{a}\smash {#1}}} \)
\( \newcommand{\id}{\mathrm{id}}\) \( \newcommand{\Span}{\mathrm{span}}\)
( \newcommand{\kernel}{\mathrm{null}\,}\) \( \newcommand{\range}{\mathrm{range}\,}\)
\( \newcommand{\RealPart}{\mathrm{Re}}\) \( \newcommand{\ImaginaryPart}{\mathrm{Im}}\)
\( \newcommand{\Argument}{\mathrm{Arg}}\) \( \newcommand{\norm}[1]{\| #1 \|}\)
\( \newcommand{\inner}[2]{\langle #1, #2 \rangle}\)
\( \newcommand{\Span}{\mathrm{span}}\)
\( \newcommand{\id}{\mathrm{id}}\)
\( \newcommand{\Span}{\mathrm{span}}\)
\( \newcommand{\kernel}{\mathrm{null}\,}\)
\( \newcommand{\range}{\mathrm{range}\,}\)
\( \newcommand{\RealPart}{\mathrm{Re}}\)
\( \newcommand{\ImaginaryPart}{\mathrm{Im}}\)
\( \newcommand{\Argument}{\mathrm{Arg}}\)
\( \newcommand{\norm}[1]{\| #1 \|}\)
\( \newcommand{\inner}[2]{\langle #1, #2 \rangle}\)
\( \newcommand{\Span}{\mathrm{span}}\) \( \newcommand{\AA}{\unicode[.8,0]{x212B}}\)
\( \newcommand{\vectorA}[1]{\vec{#1}} % arrow\)
\( \newcommand{\vectorAt}[1]{\vec{\text{#1}}} % arrow\)
\( \newcommand{\vectorB}[1]{\overset { \scriptstyle \rightharpoonup} {\mathbf{#1}} } \)
\( \newcommand{\vectorC}[1]{\textbf{#1}} \)
\( \newcommand{\vectorD}[1]{\overrightarrow{#1}} \)
\( \newcommand{\vectorDt}[1]{\overrightarrow{\text{#1}}} \)
\( \newcommand{\vectE}[1]{\overset{-\!-\!\rightharpoonup}{\vphantom{a}\smash{\mathbf {#1}}}} \)
\( \newcommand{\vecs}[1]{\overset { \scriptstyle \rightharpoonup} {\mathbf{#1}} } \)
\( \newcommand{\vecd}[1]{\overset{-\!-\!\rightharpoonup}{\vphantom{a}\smash {#1}}} \)
This is a very commonly used standardization method. To use it,
- Solutions of known concentration are prepared. (We call them standards.)
- Instrumental signal of the standard solutions are recorded.
- Instrumental signal of the samples are also recorded.
- Signal of the samples are compared with those from the standard solutions, assuming that the instrumental signal is proportional to the concentration as: SA = k * CA
- Either one standard or several standards, to create a calibration curve, may be used.
One standard calibration (one point calibration)
You will find this calibration method in many very well established methods for environmental samples analysis or even water analysis in treatment plants. This method works when it has been widely proven it is robust enough.
Answer the following questions and problem with your group. Prepare to share answers and results with the class.
- A spectrophotometric method for the quantitative determination of Pb2+ in blood produced a signal of 0.474 au for a 1.75 ppb standard solution. You need to report Pb2+ concentration in a blood drop that produces a signal of 0.361 au.
- Which one is the analyte?
- Which one is the sample?
- How much is the concentration of the standard solution?
- How much is the signal of the standard solution?
- How much is Pb2+ concentration in the blood sample?
- What advantages does this calibration method have?
- What disadvantages does this calibration method have?
- Will calibration results be affected if the sample was water?
- Which one is the analyte?

Direct calibration – Multiple standard or calibration curve.
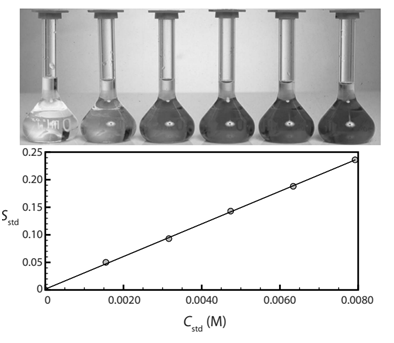
When using this method, signal of several solutions are recorded and then plotted in a graph of signal vs concentration. Of that plot, an equation (usually lineal: y = mx + b) is obtained. Concentration of the samples is obtained by substituting sample signal (y) and resolving for concentration (x).
- Another spectrophotometric method for the quantitative determination of Pb2+ in blood uses a calibration curve with several standard solutions. Results gave a calibration like the one below and a linear equation:
\[S_{estd}=(0.296\: ppb^{-1})\times C_{estd}+0.003 \nonumber\]
-
What is Pb2+ concentration in a sample that produced a signal of 0.397 au?
- What advantages does this calibration method have?
- What disadvantages does this calibration method have?
- Will calibration results be affected if the sample was water?
-
A disadvantage of the previous calibration methods is that the standard solutions need to be as similar to the sample as possible, to avoid matrix interference.
- In the determination of Pb2+ in blood, which is the matrix?
For example, if water is being analyzed, standards are prepared in aqueous solutions; however, if benzene dissolved in hexane is being determined, standards have to be made in hexane as solvent. Instruments may give different responses if aqueous or organic solvents are being used.
- Which of the following pairs may have more complex matrix:
-
Rain water or seawater ______________________
- Blood or drinking water ______________________
-
- Matrix interference may affect more instrumental signal of a spectrophotometer in which of those solutions?
-
________________________________
- ________________________________
-
- Would that affect the results?
- Will the instrumental signal be larger, smaller or the same if matrix interference is present? Can you predict it?
The graph below shows a calibration curve of standard solutions, one is made in aqueous solutions (standard matrix) and the other with standards prepared in matrix similar to the sample (sample’s matrix). For example: to analyze seawater the standard’s matrix may be prepared in distilled water, while the sample’s matrix standards were prepared using a saline solution.
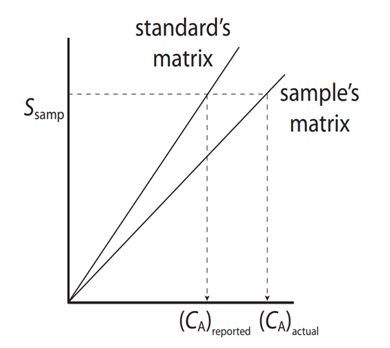
- What differences are between the curves?
- Which one of the calibration curves is more sensible?
- If this was done to analyze seawater, would you recommend using the one or multiple calibration point method with standards prepared in distilled water?
- Does the matrix affect the response of the instrument? Will that affect the quality of the results? How?
- What would you recommend?
NOTE: To create a robust method, matrix interferences have to be tested!