
Calibration Curves (Mullaugh)
- Page ID
- 281402

CHEM 220: Fundamentals of Analytical Chem
Learning Objectives
Following this activity, students should be able to:
- Use calibration curves to convert analytical signals into concentrations.
- Propagate uncertainty from a calibration curve.
- Evaluate the quality of a calibration curve.
- Apply “best practices” in the construction and use of calibration curves in chemical analysis.
Based on your experience with calibration curves…
- In CHEM 220L you have used calibration curves a number of times in completing your chemical analyses. You likely have used calibration curves before in other labs as well. Discuss with your group and make a list of what you can remember.
- What were the labels on the y-axis and x-axis in the calibration curves? For example, in the analysis of the iron vitamins you plotted absorbance on the y-axis and concentration on the x-axis.
- Give a general description of how a calibration curve is used to determine an unknown concentration.
- After consulting with your group, sketch an example (and label the axes!) of a “good” and “bad” calibration curve.
Calibration Curve
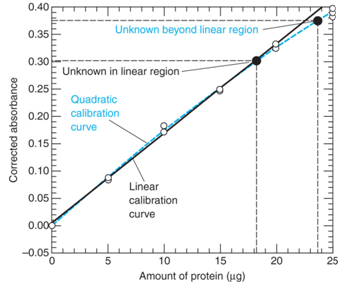
Below are data from a spectroscopic analysis of a protein. Take a moment to look over the table and graph below.
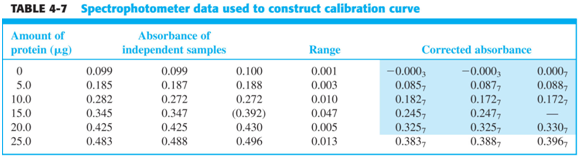
- How is the absorbance “corrected”? Why do you think it is necessary to do so?
- Note that one of the 15 ug standards is omitted from the graph. Why?
- Below are the results of the “LINEST” function of Excel for the equation of a line y = mx + b.
m = 0.0162963
b = 0.0047
sm = 0.00021847
sb = 0.00262749
R2 = 0.99784795
sy = 0.00587525
If an unknown sample had an absorbance of 0.234, what is the concentration of protein in the sample?
Propagation of Uncertainty
As you might imagine, a concentration determined from a “good” calibration curve is more accurate than one from a “bad” calibration curve. Therefore, it is necessary to use the quality of the fit between the line equation and actual data points to determine how much uncertainty is associated with the resulting concentration.
To determine the uncertainty of a value determined with a calibration curve, we will use the following equation.
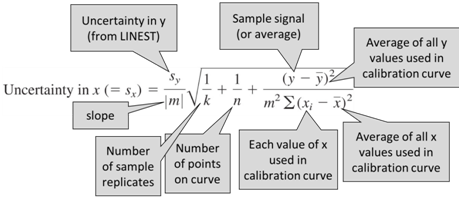
- Consider the above equation and discuss with your group how you might design your analysis to minimize uncertainty. Note that the uncertainty in concentration (sx) is minimized when the sample signal is closest to the average of the standards used to prepare the calibration curve.
- Determine the uncertainty of the concentration (sx) found in question 7.
- Assume you analyzed another sample with an absorbance of 0.561. Can you treat this sample the same as you did for the previous sample? If not, what would you suggest doing differently and why?
- Based on your previous lab experiences and your understanding of uncertainty originating from calibration curves, make a list of “tips” for a student new to using calibration curves in chemical analysis.
Contributors and Attributions
- Kate Mullaugh, College of Charleston (mullaughkm@cofc.edu)
- Some of the figures in this activity are from: Harris, Daniel C. Quantitative Chemical Analysis; W. H. Freeman: New York, NY, 2010; pp 87-88.
- Sourced from the Analytical Sciences Digital Library