
Calibration
- Page ID
- 281396

Why does concentration matter?
Accurately knowing the amount, in terms of concentration, of a particular substance (analyte) is important in fundamental research and also in many applied fields of study.
Why calibrate?
In order to determine the concentration of a particular analyte in a sample using a specific instrument we must perform a procedure called “concentration calibration.” While analytes themselves cannot be measured directly, specific properties of the analyte are measurable. Many analysis techniques provide a response (signal) to a solution containing some concentration of an analyte. For example, the light absorption properties of a chemical may be measured to determine its concentration in a sample.
Calibration is the process of determining the sensitivity of an instrument to a particular analyte, or the relationship between the signal and the amount of analyte in a sample.
Exercise 1 – Method of Standard Addition
You suspect that matrix effects (ionization suppression) in river water will be significant when using LC-MS to measure the amount of the herbicide glyphosate in river water, so you decide to use the method of standard addition. The river water sample you’re interested in yielded an LC-MS peak area of 1000. After spiking a replicate river water sample with 4 μg of glyphosate (assume this does not change the volume of the extract), the peak area jumps to 3000. Use a graphical method to determine the mass of glyphosate in the original (un-spiked) river water sample.
Exercise 2 – Internal Standards
For the determination of 2,3-butanedione (diacetyl; boiling point 88 °C; buttery flavor) in beer, a headspace gas chromatography method is utilized. Standards and beer samples are heated in special vials at 60 °C for 45 min. Once heated, a 500-μL sample is collected from the headspace of each vial using a gas-tight syringe and injected onto the instrument.
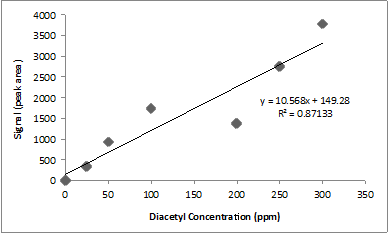
A research student runs diacetyl standards and constructs the calibration curve above.
The poor linear relationship in the calibration curve shown above could be due to a variety of factors including different injection volumes, sample temperatures, and heating times. Can you tell just by looking which data points are wonky?
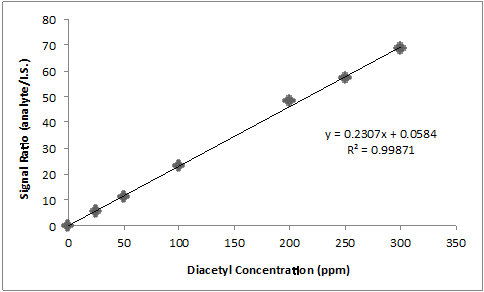
An internal standard (I.S.) in analytical chemistry is a substance similar to the analyte that is added in a constant amount to the blank, the standards, and the samples. They are useful to compensate for changes in extraction efficiency, detector response due to sample loss during other sample preparation steps, fluctuations in sample analyzed, or changes in detector response due to different flow rates. Internal standards are widely used in chromatography because of differences in the reproducibility of sample injected into the chromatograph. All of these changes should affect the internal standard to the same degree as the analyte so that the relative ratio of the standard to analyte remains constant.
For the quantification of diacetyl in beer, 2,3-hexanedione is most commonly utilized as an internal standard. The same amount of internal standard is added to all standards and samples. Then, one can create an internal calibration curve by plotting the relative signal (analyte/I.S.) vs. the concentration of analyte, as shown in the data in the table and plot below.
|
Diacetyl (analyte, ppm) |
2,3-hexanedione (I.S., ppm) |
Analyte peak area |
I.S. peak area |
Signal ratio (analyte/I.S.) |
|---|---|---|---|---|
|
0 |
0.05 |
0 |
58 |
0 |
|
25 |
0.05 |
330 |
59 |
5.59 |
|
50 |
0.05 |
911 |
82 |
11.11 |
|
100 |
0.05 |
1720 |
74 |
23.24 |
|
200 |
0.05 |
1352 |
28 |
48.29 |
|
250 |
0.05 |
2745 |
48 |
57.19 |
|
300 |
0.05 |
3762 |
55 |
68.40 |
A beer sample spiked with 0.05 ppm internal standard has a diacetyl peak area of 1497 and an I.S. peak area of 63.0. What is the concentration of diacetyl in the beer?
Contributors and Attributions
- David Griffith, Willamette University (dgriffit@willamette.edu)
- (Adapted from R. Hunter, ASDL, 2017)
- Sourced from the Analytical Sciences Digital Library