
Beer’s Law
- Page ID
- 291734

\( \newcommand{\vecs}[1]{\overset { \scriptstyle \rightharpoonup} {\mathbf{#1}} } \)
\( \newcommand{\vecd}[1]{\overset{-\!-\!\rightharpoonup}{\vphantom{a}\smash {#1}}} \)
\( \newcommand{\dsum}{\displaystyle\sum\limits} \)
\( \newcommand{\dint}{\displaystyle\int\limits} \)
\( \newcommand{\dlim}{\displaystyle\lim\limits} \)
\( \newcommand{\id}{\mathrm{id}}\) \( \newcommand{\Span}{\mathrm{span}}\)
( \newcommand{\kernel}{\mathrm{null}\,}\) \( \newcommand{\range}{\mathrm{range}\,}\)
\( \newcommand{\RealPart}{\mathrm{Re}}\) \( \newcommand{\ImaginaryPart}{\mathrm{Im}}\)
\( \newcommand{\Argument}{\mathrm{Arg}}\) \( \newcommand{\norm}[1]{\| #1 \|}\)
\( \newcommand{\inner}[2]{\langle #1, #2 \rangle}\)
\( \newcommand{\Span}{\mathrm{span}}\)
\( \newcommand{\id}{\mathrm{id}}\)
\( \newcommand{\Span}{\mathrm{span}}\)
\( \newcommand{\kernel}{\mathrm{null}\,}\)
\( \newcommand{\range}{\mathrm{range}\,}\)
\( \newcommand{\RealPart}{\mathrm{Re}}\)
\( \newcommand{\ImaginaryPart}{\mathrm{Im}}\)
\( \newcommand{\Argument}{\mathrm{Arg}}\)
\( \newcommand{\norm}[1]{\| #1 \|}\)
\( \newcommand{\inner}[2]{\langle #1, #2 \rangle}\)
\( \newcommand{\Span}{\mathrm{span}}\) \( \newcommand{\AA}{\unicode[.8,0]{x212B}}\)
\( \newcommand{\vectorA}[1]{\vec{#1}} % arrow\)
\( \newcommand{\vectorAt}[1]{\vec{\text{#1}}} % arrow\)
\( \newcommand{\vectorB}[1]{\overset { \scriptstyle \rightharpoonup} {\mathbf{#1}} } \)
\( \newcommand{\vectorC}[1]{\textbf{#1}} \)
\( \newcommand{\vectorD}[1]{\overrightarrow{#1}} \)
\( \newcommand{\vectorDt}[1]{\overrightarrow{\text{#1}}} \)
\( \newcommand{\vectE}[1]{\overset{-\!-\!\rightharpoonup}{\vphantom{a}\smash{\mathbf {#1}}}} \)
\( \newcommand{\vecs}[1]{\overset { \scriptstyle \rightharpoonup} {\mathbf{#1}} } \)
\(\newcommand{\longvect}{\overrightarrow}\)
\( \newcommand{\vecd}[1]{\overset{-\!-\!\rightharpoonup}{\vphantom{a}\smash {#1}}} \)
\(\newcommand{\avec}{\mathbf a}\) \(\newcommand{\bvec}{\mathbf b}\) \(\newcommand{\cvec}{\mathbf c}\) \(\newcommand{\dvec}{\mathbf d}\) \(\newcommand{\dtil}{\widetilde{\mathbf d}}\) \(\newcommand{\evec}{\mathbf e}\) \(\newcommand{\fvec}{\mathbf f}\) \(\newcommand{\nvec}{\mathbf n}\) \(\newcommand{\pvec}{\mathbf p}\) \(\newcommand{\qvec}{\mathbf q}\) \(\newcommand{\svec}{\mathbf s}\) \(\newcommand{\tvec}{\mathbf t}\) \(\newcommand{\uvec}{\mathbf u}\) \(\newcommand{\vvec}{\mathbf v}\) \(\newcommand{\wvec}{\mathbf w}\) \(\newcommand{\xvec}{\mathbf x}\) \(\newcommand{\yvec}{\mathbf y}\) \(\newcommand{\zvec}{\mathbf z}\) \(\newcommand{\rvec}{\mathbf r}\) \(\newcommand{\mvec}{\mathbf m}\) \(\newcommand{\zerovec}{\mathbf 0}\) \(\newcommand{\onevec}{\mathbf 1}\) \(\newcommand{\real}{\mathbb R}\) \(\newcommand{\twovec}[2]{\left[\begin{array}{r}#1 \\ #2 \end{array}\right]}\) \(\newcommand{\ctwovec}[2]{\left[\begin{array}{c}#1 \\ #2 \end{array}\right]}\) \(\newcommand{\threevec}[3]{\left[\begin{array}{r}#1 \\ #2 \\ #3 \end{array}\right]}\) \(\newcommand{\cthreevec}[3]{\left[\begin{array}{c}#1 \\ #2 \\ #3 \end{array}\right]}\) \(\newcommand{\fourvec}[4]{\left[\begin{array}{r}#1 \\ #2 \\ #3 \\ #4 \end{array}\right]}\) \(\newcommand{\cfourvec}[4]{\left[\begin{array}{c}#1 \\ #2 \\ #3 \\ #4 \end{array}\right]}\) \(\newcommand{\fivevec}[5]{\left[\begin{array}{r}#1 \\ #2 \\ #3 \\ #4 \\ #5 \\ \end{array}\right]}\) \(\newcommand{\cfivevec}[5]{\left[\begin{array}{c}#1 \\ #2 \\ #3 \\ #4 \\ #5 \\ \end{array}\right]}\) \(\newcommand{\mattwo}[4]{\left[\begin{array}{rr}#1 \amp #2 \\ #3 \amp #4 \\ \end{array}\right]}\) \(\newcommand{\laspan}[1]{\text{Span}\{#1\}}\) \(\newcommand{\bcal}{\cal B}\) \(\newcommand{\ccal}{\cal C}\) \(\newcommand{\scal}{\cal S}\) \(\newcommand{\wcal}{\cal W}\) \(\newcommand{\ecal}{\cal E}\) \(\newcommand{\coords}[2]{\left\{#1\right\}_{#2}}\) \(\newcommand{\gray}[1]{\color{gray}{#1}}\) \(\newcommand{\lgray}[1]{\color{lightgray}{#1}}\) \(\newcommand{\rank}{\operatorname{rank}}\) \(\newcommand{\row}{\text{Row}}\) \(\newcommand{\col}{\text{Col}}\) \(\renewcommand{\row}{\text{Row}}\) \(\newcommand{\nul}{\text{Nul}}\) \(\newcommand{\var}{\text{Var}}\) \(\newcommand{\corr}{\text{corr}}\) \(\newcommand{\len}[1]{\left|#1\right|}\) \(\newcommand{\bbar}{\overline{\bvec}}\) \(\newcommand{\bhat}{\widehat{\bvec}}\) \(\newcommand{\bperp}{\bvec^\perp}\) \(\newcommand{\xhat}{\widehat{\xvec}}\) \(\newcommand{\vhat}{\widehat{\vvec}}\) \(\newcommand{\uhat}{\widehat{\uvec}}\) \(\newcommand{\what}{\widehat{\wvec}}\) \(\newcommand{\Sighat}{\widehat{\Sigma}}\) \(\newcommand{\lt}{<}\) \(\newcommand{\gt}{>}\) \(\newcommand{\amp}{&}\) \(\definecolor{fillinmathshade}{gray}{0.9}\)Learning Objectives
Following this activity, students will be able to:
- Describe the relationship between absorbance and transmittance.
- Develop a proportional relationship between absorbance and concentration.
- Account for the role of sample pathlength in absorbance measurements.
- Determine the molar absorptivity of a compound based on its absorbance behavior according to Beer’s Law.
- Construct a spectrum from absorbance measurements at various concentrations.
Introduction to Beer’s Law
Beer’s Law describes the linear relationship between the absorbance of electromagnetic radiation (i.e., light) and concentration. This relationship is used extensively in a variety of chemical analyses, from simple test kits that produce a color in the presence of certain analytes to high-end liquid chromatography instrumentation. Most absorbance measurements require the same basic set up: a light source, a means to select a narrow range of wavelengths of light, a sample cell and a detector that can measure the power of radiation passing through samples and reference solutions. A spectrometer’s detector measure transmittance (T) of light through a sample (Psam) relative to the power of light that passes through a reference (Pref).
\[T=\dfrac{P_{sam}}{P_{ref}}\nonumber\]
Transmittance is often expressed as a percent (T x 100%), but most often we use absorbance (A).
\[A=-\log(T)=\log\left(\dfrac{P_{ref}}{P_{sam}} \right )\nonumber\]
Absorbance is often preferred because it is directly proportional to concentration, as described by Beer’s Law.
\[A=\varepsilon bC \nonumber\]
Where A is absorbance, ε is molar absorptivity, b is the path length of the cell and C is the concentration of the solution. Molar absorptivity is characteristic of the analyte molecules and depends on the wavelength of light. We will also observe ways absorbance can change due to changes in the chemical environment of the analyte, such as solvent, concentration and pH.
Part I: Beer’s Law Basics
Follow this link to access the Beer’s Law simulator: https://goo.gl/3etxTt Click on the button for the Beer’s Law simulation. Take a moment to familiarize yourself with the layout.
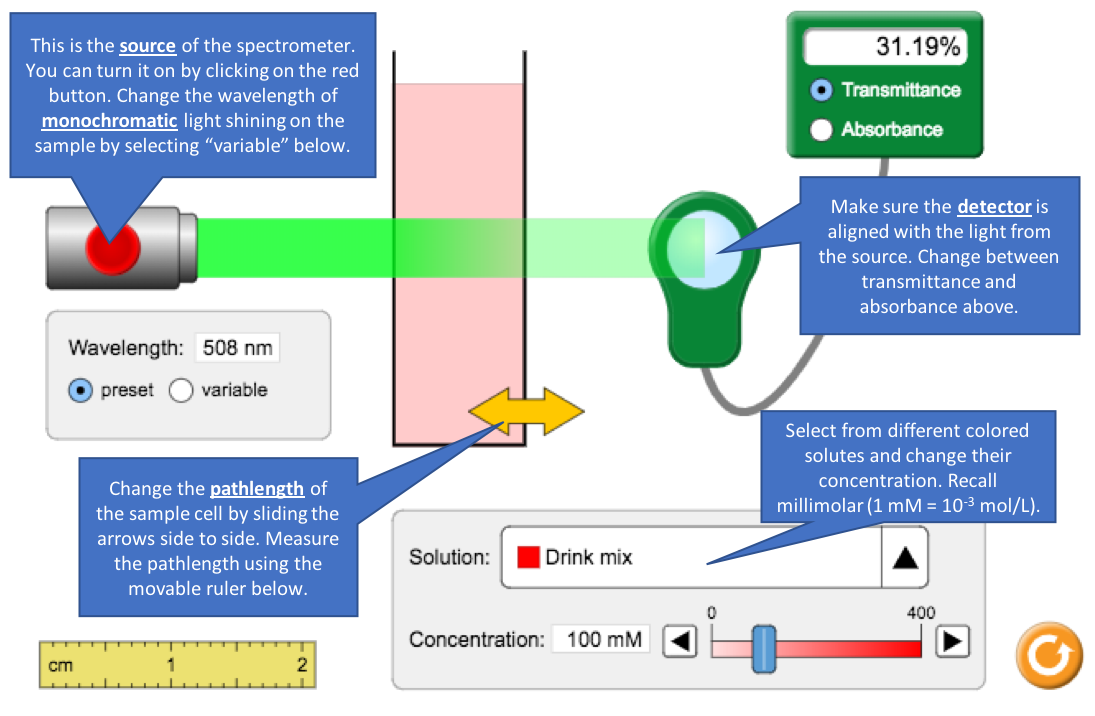
- Turn on the light source to analyze the 100 mM drink mix solution.
- What is the transmittance and absorbance? Confirm that they agree by substituting into the equation relating them.
- Decrease the concentration of the drink solution to 50 mM. How do transmittance and absorbance each change when concentration is halved?
- Increase the drink concentration as high as it will go to 400 mM. It is considered poor analytical practice to use absorbance values that exceed 2. Why?
- If you were in the lab and measured an absorbance greater that 2.00, what should you do?
- What is the transmittance and absorbance? Confirm that they agree by substituting into the equation relating them.
- Note the source has a specific wavelength. What part of the spectrometer ensures only a narrow range of wavelengths passes through the sample? Why is this important for Beer’s Law?
- Select a solute and concentration. Using its preset wavelength, measure the absorbance with different pathlengths. Move the ruler to measure the path the light takes through the sample.
Solute: ___________________________
Concentration: ________
Pathlength (cm)
0.5
1.0
1.5
2.0
Absorbance
- What term in Beer’s Law corresponds to pathlength? Where your observations above consistent with Beer’s Law?
- When would using a long pathlength be desirable?
- What term in Beer’s Law corresponds to pathlength? Where your observations above consistent with Beer’s Law?
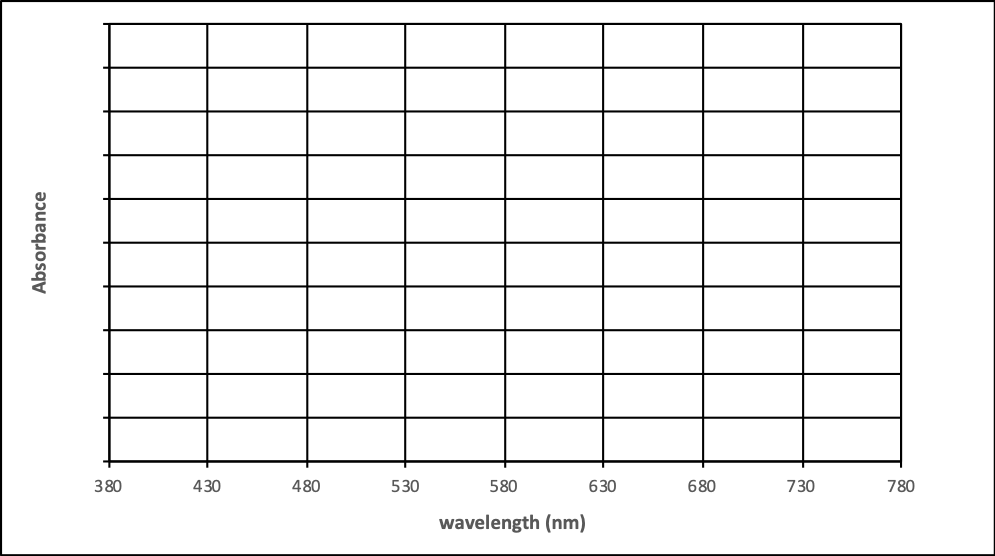
- Select a different solute, concentration and pathlength. Record the absorbance and transmittance at λmax. Switch to variable wavelength mode and measure the absorbance every 50 nm. Use this information to sketch the spectrum on the next page. Compare the spectra in absorbance and transmittance.
Solute: _______________ Concentration: ________ Pathlength: ____ cm
|
Wavelength (nm) |
Absorbance |
Transmittance |
|---|---|---|
|
λmax = |
|
|
|
380 |
|
|
|
430 |
|
|
|
480 |
|
|
|
530 |
|
|
|
580 |
|
|
|
630 |
|
|
|
680 |
|
|
|
730 |
|
|
|
780 |
|
|

Contributors and Attributions
- Kate Mullaugh, College of Charleston (mullaughkm@cofc.edu)
- Sourced from the Analytical Sciences Digital Library