
6.10: Energies, Kinetics, and Catalysts
- Page ID
- 43792
Reaction Rates (Kinetics) and Reaction Energy Diagrams
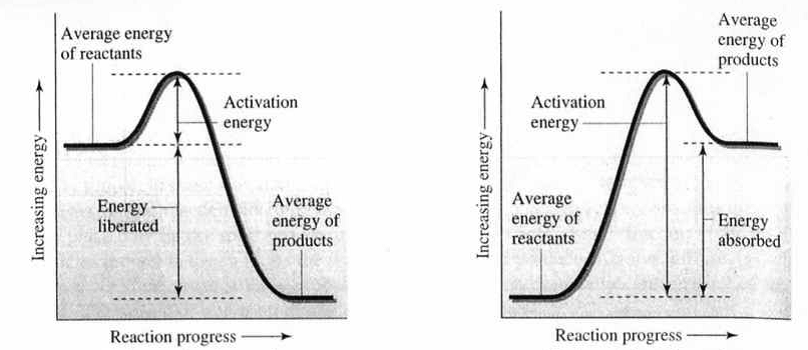
Reaction energy diagrams summarize the important information about a reaction in a single graph. The y-axis represents the energy and the x-axis represents the reaction progress (time). The relative energies of the reactants and products are determined by the potential energy stored within the molecules as chemical bonds. For an exothermic reaction, the products are lower in energy than the reactants resulting in a release of heat. For an endothermic reaction, the products are higher in energy than the reactants requiring the constant addition of heat to keep the reaction going. From Collision Theory, we have learned that the reactants must possess a minimum amount of collision energy for a reaction to occur. In a reaction energy diagram, this minimum collision energy is described as the “activation energy” (\(E_a'\)). Because the activation energy can be viewed as a barrier to a reaction, a larger activation energy indicates a slower the reaction rate and a smaller activation energy indicates a faster the reaction rate.
Reaction A Reaction B
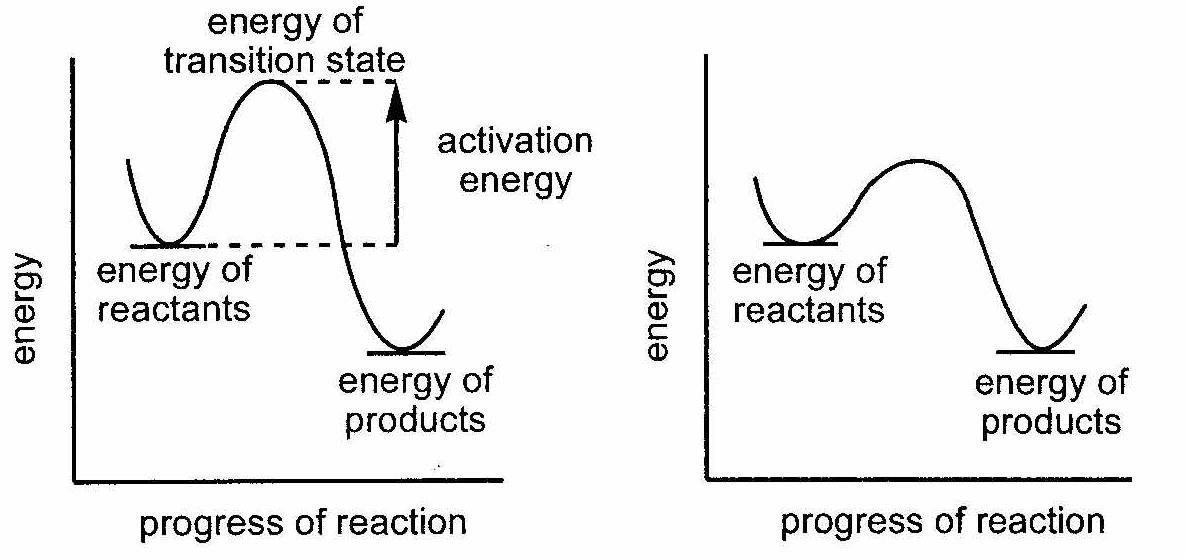
Catalysts are substances that speed up a reaction without being consumed or changed by the reaction. Because of these properties, catalysts can be added in small quantities to increase reaction rates. Catalysts increase reaction rates by decreasing the activation energy of a reaction. The transition state represents the reactants in the correct orientation with the minimum collision energy for a reaction to occur. The energy difference between the reactants and the transition state is the activation energy. The addition of a catalyst to Reaction C increases the reaction rate by decreasing the activation energy as shown below.
Reaction C – No Catalyst Reaction C – With catalyst
Follow-up questions
- Use the reaction diagrams below to answer the following questions.
- Predict which reaction occurs at a faster rate.
- Label the enthalpy and indicate whether it is positive or negative.
- Label the transition states.
- Overlay a second reaction energy curve for Reaction B when a catalyst is added.
Reaction A Reaction B