
Time-resolved vs. Frequency Resolved
- Page ID
- 1786
Spectroscopic measurements are typically taken in one of two domains: frequency or time. These measurements are given the terms frequency-resolved or time-resolved. Frequency-resolved measurements are the most familiar forms of spectroscopy. UV/Visible, IR, Raman, and X-ray spectroscopy are typically done in the frequency domain. This type of spectroscopy acquires data across a range of frequencies (or wavelengths). The data acquired is typically in the form of an light intensity which can in turn be interpreted as absorbance, transmittance, reflectance, or photon scattering depending on the instrument and technique being used.
Introduction
The less familiar time-resolved spectroscopy includes Ultrafast laser spectroscopy and florescence. In this form of spectroscopy data is acquired over a range of time. This data can be at a single wavelength or at multiple wavelengths, depending on the specific technique. Some spectroscopic techniques, such as Ultrafast laser spectroscopy, FT-NMR and FT-IR, span both frequency and time domains. In the case of Ultrafast laser spectroscopy, useful data is acquired in both the time and frequency domains. FT-NMR and FT-IR acquire data in the time domain. That data is then converted into a signal in the frequency domain using a process called Fourier Transform. This is covered in more detail below.
Frequency Resolution
Frequency is defined as inverse time. The unit is typically given in inverse seconds(s-1) or hertz(hz). Frequency is used to represent the number of cycles occurring in a given time period. These cycles could be any repetitive process including: the periodic motion of a harmonic oscillator, the sinusoidal propagation of electromagnetic radiation, or the rotation of a rigid rotator. The most relevant for spectroscopy is the propagation or electromagnetic radiation, or light. This is often represented in many different forms that, though not technically frequency, are related to frequency, and therefore fall into the frequency domain. These include representing frequency as wavelength (nm), wavenumber (cm-1), and photon energy (eV). These are all connected by a few simple equations given below. (c=speed of light, E=energy, v=frequency, w=wavenumber, h=Planck's constant,lambda=wavelength)
\(\lambda = \dfrac{c}{\nu}\)
\(E = h\nu\)
\(w = \dfrac{1}{\lambda}\)
The frequency domain is the most familiar domain in spectroscopy. UV/visible, infrared, photoelectron, microwave, and X-ray spectroscopy all have applications in the frequency domain. The results of these spectroscopic techniques are typically given in some form of intensity versus wavelength. The most familiar is likely the steady state ultraviolet/visible absorption spectrum(an example is shown below).
Frequency Resolved Visible Absorption Spectrum
.jpg?revision=1&size=bestfit&width=402&height=302)
The energy of absorbed light corresponds to the energy of transition between two eigen states of the system. In the case of visible spectroscopy these states are electronic states.
Time Resolution
Spectra can also be acquired in the time domain. Rather than acquiring spectra by averaging data over a relatively long time range, data is acquired over discrete time intervals or, in some cases, continuously. This may be done over one or many wavelengths. Time resolved spectroscopy observes the change in eigenstates with respect to time. In order for data from time-resolved spectroscopy to be useful, the spectroscopy must be suited to the time scale of the process of interest. Below is a table of the approximate time scales and spectral ranges of physical processes that may be interesting.
| Process | Time | Applicable Spectral Range |
|---|---|---|
| Singlet Electronic Excited State Lifetime | femto-nanoseconds | Visible |
| Triplet Electronic Excited State Lifetime | nanoseconds-minutes | Visible |
| Molecular Vibration Excited State Lifetime | pico-milliseconds | Infrared |
| Nuclear Rotation | pico-microseconds | Radio |
| Molecular Reaction Kinetics | eons-picoseconds | Varies |
If a spectroscopy with suitable spectral region and time resolution is available, time resolved spectroscopy can be used to study kinetics, reactions, and lifetimes. Common applications of time-resolved spectroscopy include ultrafast laser spectroscopy and time-resolved florescence.
Fourier Transform
The process of Fourier Transform is a mathematical process used to move from one set of coordinates to another. The most spectroscopically relevant fourier transform is from the time domain to the frequency domain. In this case, a signal originally measured in the time domain can be converted into a signal in the frequency domain. This is done via the mathematical process shown below.
\(\displaystyle F(v) = \int_{-\infty}^{\infty} f(t)e^{-2i\pi vt}dt\)
\(\displaystyle f(t) = \int_{-\infty}^{\infty} F(v)e^{-2i\pi vt}dv\)
A mathematical relation known as Euler's Formula is an important identity when using Fourier Transform, particularly with sine and cosine functions. This is shown below.
\(e^{\pm ix} = cos(x) \pm isin(x)\)
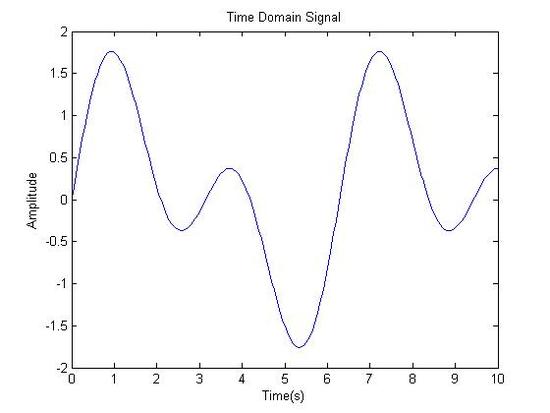
A simple graphic representation of Fourier Transform is shown below.
Original Signal in Time Domain
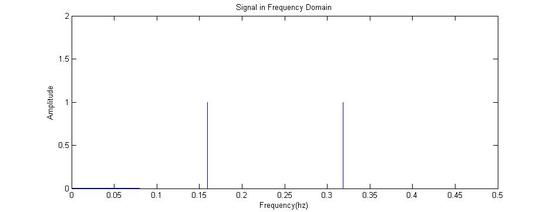
Fourier Transformed: Signal in Frequency Domain
Fourier Transformed Again: Signal in Time Domain (The Components of the Original Signal)
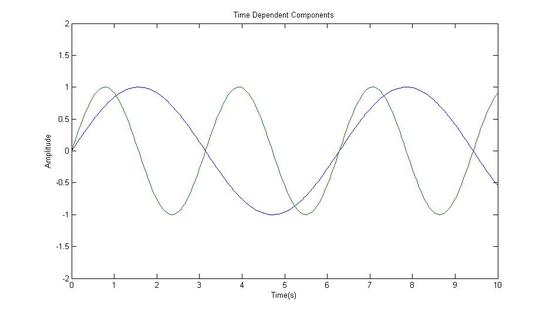
Sum of the Components(Equivalent to the Original Signal)
An example fourier transform with sine is given in the links section.
Common Application of Fourier Transform
Some fields of spectroscopy use measurements taken in the time domain to gain information about the frequency domain. These spectroscopies include Nuclear Magnetic Resonance, Fourier Transform Ion Cyclotron Resonance Mass Spectroscopy(FT-ICR MS) and Fourier Transform Infrared spectroscopy(FT-IR). Unlike the above graphic representation of Fourier Transform, these systems yield transforms that are impossible to compute by hand. Computer algorithms must be used.
The initial signal typically forms a beat pattern. This can be in the form of an interferogram or a free induction decay(FID), in the cases of FT-IR and NMR, respectively. Graphic representations of an interferogram and FID are shown below alongside IR and NMR spectra.
FT-IR Spectra
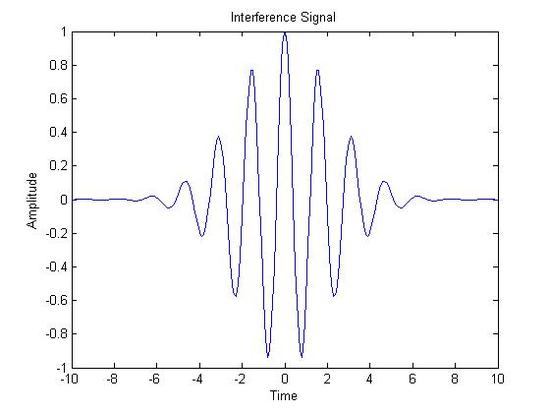
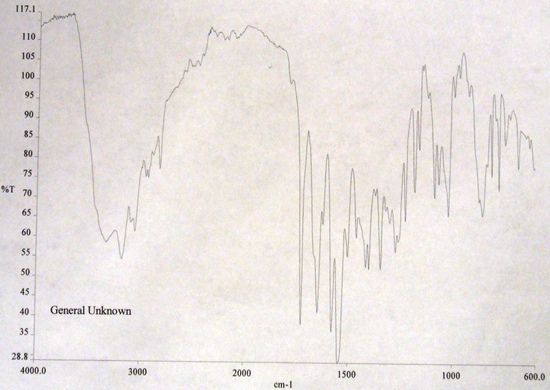
Interferogram(X-axis: Time|Y-Axis:Amplitude) Infrared Spectrum(X-axis: Wave Number (cm-1)|Y-axis: Percent Transmission)
FT-NMR Spectra
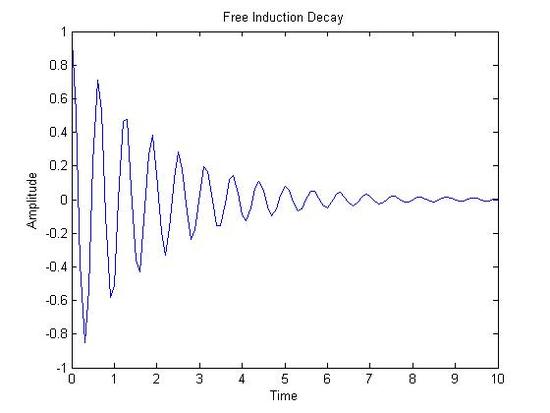
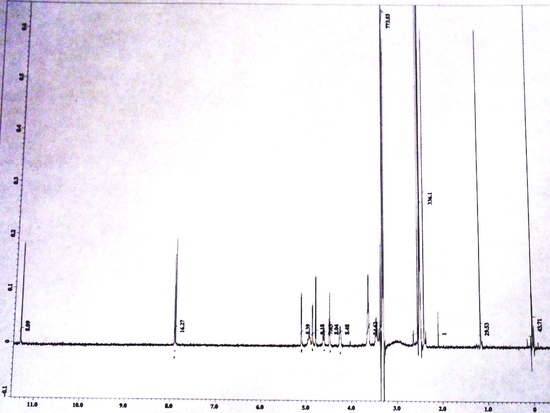
Free Induction Decay(X-axis: Time|Y-axis: Amplitude) NMR Spectrum(X-axis: Chemical Shift (ppm)|Y-axis: Amplitude)
Spectroscopy in Both Time and Frequency Domains
Some spectroscopies yield data in both time and frequency domains. The most prominent of these techniques is time-resolved laser spectroscopy. By measuring complete spectra at discrete time intervals, spectral evolution with respect to time can be monitored. This technique is unique in it's ability to collect data in multiple domains with femtosecond time resolution. This allows electronic states to be monitored both as they evolve over time and statically at any particular time along the time scale of the instrument. Below is an example of a typical ultrafast spectrum, notice both wavelength and time domains. This three-dimensional spectrum can be deconstructed to yield either time or frequency dependent results in two-dimensions. This is also shown below.
Time Resolved Visible Absorbance Spectrum
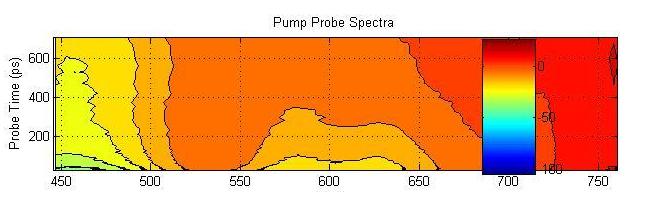
(X-axis:Wavelength(nm)|Y-axis:Time(ps)|Z-axis:(ABS)[Shown as color])
The time resolved spectrum shown above is plotted as a contour plot showing the Z-axis as a color gradient from red(low signal) to blue(high signal). This contour plot contains a multitude of information, but is by itself not terribly useful. It is most easily analyzed by taking crossections at a single wavelength or time. Each is shown below.
Frequency Domain Signal (A crossection of the Time Resolved Spectrum constant time)
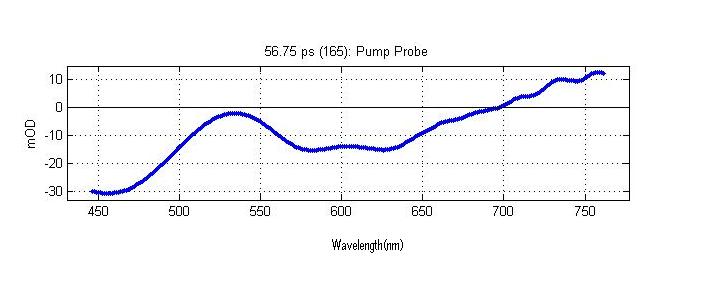
The above spectrum is a crossection of the complete time resolved spectrum. This particular crossection is the frequency domain signal at 56.75 picoseconds after the sample has been excited by a laser pulse.
Time Domain Signal (A crossection of the Time Resolved Spectrum at a single Wavelength)
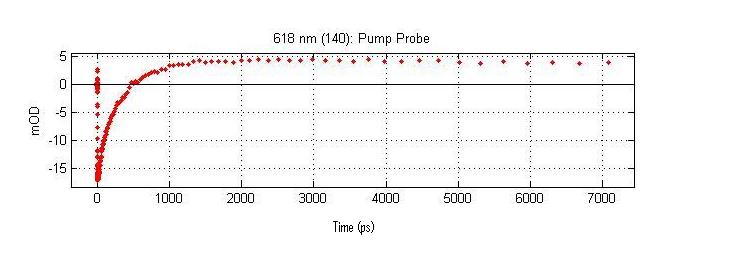
The above spectrum is a crossection of the complete time resolved spectrum. This crossection is the time resolved signal at 618 nanometers. This crossection contains kinetic data on the eigen state that absorbs at 618nm.
References
- Skoog, Douglas A. Principles of Instrumental Analysis. 5th ed. New York:Thompson Learning Incorporated,1998.
- Atkins, Peter. Physical Chemistry. 7th ed. New York: W.H. Freeman, 2002.
Outside Links
- For a more in-depth/mathematical look at fourier transform: en.Wikipedia.org/wiki/Fourier_transform
- Fourier transform of a sine function: http://mathworld.wolfram.com/FourierTransformSine.html
- For a more in depth look at Euler's Formula: http://en.Wikipedia.org/wiki/Euler%27s_formula
- Use of Fourier Transform in FT-ICR Mass Spectroscopy: www.youtube.com/watch?v=7EHngA4S3Ws