20.7F: Interpretation of Electronic Absorption Spectra - Tanabe-Sugano Diagrams
- Page ID
- 34405

For ALL octahedral complexes, except high spin d5, simple CFT would predict that only 1 band should appear in the electronic spectrum and that the energy of this band should correspond to the absorption of energy equivalent to Δ. In practice, ignoring spin-forbidden lines, this is only observed for those ions with D free ion ground terms i.e., d1, d9 as well as d4, d6.
The observation of 2 or 3 peaks in the electronic spectra of d2, d3, d7 and d8 high spin octahedral complexes requires further treatment involving electron-electron interactions. Using the Russell-Saunders (LS) coupling scheme, these free ion configurations give rise to F free ion ground states which in octahedral and tetrahedral fields are split into terms designated by the symbols A2(g), T2(g) and T1(g).
To derive the energies of these terms and the transition energies between them is beyond the needs of introductory level courses and is not covered in general textbooks[10,11]. A listing of some of them is given here as an Appendix. What is necessary is an understanding of how to use the diagrams, created to display the energy levels, in the interpretation of spectra.
In the laboratory component of the course we will measure the absorption spectra of some typical chromium(III) complexes and calculate the spectrochemical splitting factor, Δ. This corresponds to the energy found from the first transition below and as shown in Table 1 is generally between 15,000 cm-1 (for weak field complexes) and 27,000 cm-1 (for strong field complexes).
For the d3 octahedral case, 3 peaks can be predicted and these would correspond to the following transitions and energies:
- 4T2g ← 4A2g transition energy = Δ
- 4T1g(F) ← 4A2g transition energy = 9/5 * Δ - C.I.
- 4T1g(P) ← 4A2g transition energy = 6/5 * Δ + 15B' + C.I.
where C.I. is the configuration interaction arising from the "non-crossing rule".
|
Complex |
ν1 |
ν2 |
ν3 |
ν2/ ν1 |
ν1/ ν2 |
Δ/B |
Ref |
|---|---|---|---|---|---|---|---|
| Cr3+ in emerald |
16260 |
23700 |
37740 |
1.46 |
0.686 |
20.4 |
13 |
| K2NaCrF6 |
16050 |
23260 |
35460 |
1.45 |
0.690 |
21.4 |
13 |
| [Cr(H2O)6]3+ |
17000 |
24000 |
37500 |
1.41 |
0.708 |
24.5 |
This work |
| Chrome alum |
17400 |
24500 |
37800 |
1.36 |
0.710 |
29.2 |
4 |
| [Cr(C2O4)3]3- |
17544 |
23866 |
? |
1.37 |
0.735 |
28.0 |
This work |
| [Cr(NCS)6]3- |
17800 |
23800 |
? |
1.34 |
0.748 |
31.1 |
4 |
| [Cr(acac)3] |
17860 |
23800 |
? |
1.33 |
0.752 |
31.5 |
This work |
| [Cr(NH3)6]3+ |
21550 |
28500 |
? |
1.32 |
0.756 |
32.6 |
4 |
| [Cr(en)3]3+ |
21600 |
28500 |
? |
1.32 |
0.758 |
33.0 |
4 |
| [Cr(CN)6]3- |
26700 |
32200 |
? |
1.21 |
0.829 |
52.4 |
4 |
For octahedral Ni(II) complexes the transitions would be:
- 3T2g ← 3A2g transition energy = Δ
- 3T1g(F) ← 3A2g transition energy = 9/5 * Δ - C.I.
- 3T1g(P) ← 3A2g transition energy = 6/5 * Δ + 15B' + C.I.
where C.I. again is the configuration interaction and as before the first transition corresponds exactly to Δ.
For M(II) the size of Δ is much less than for M(III) and typical values for Ni(II) are 6500 to 13000 cm-1 as shown in Table 2.
|
Complex |
ν1 |
ν2 |
ν3 |
ν1 |
ν1/ ν2 |
Δ/B |
Ref |
|---|---|---|---|---|---|---|---|
| NiBr2 |
6800 |
11800 |
20600 |
1.74 |
0.576 |
5 |
13 |
| [Ni(H2O)6]2+ |
8500 |
13800 |
25300 |
1.62 |
0.616 |
11.6 |
13 |
| [Ni(gly)3]- |
10100 |
16600 |
27600 |
1.64 |
0.608 |
10.6 |
13 |
| [Ni(NH3)6]2+ |
10750 |
17500 |
28200 |
1.63 |
0.614 |
11.2 |
13 |
| [Ni(en)3]2+ |
11200 |
18350 |
29000 |
1.64 |
0.610 |
10.6 |
3 |
| [Ni(bipy)3]2+ |
12650 |
19200 |
? |
1.52 |
0.659 |
17 |
3 |
For d2 octahedral complexes, few examples have been published. One such is V3+ doped in Al2O3 where the vanadium ion is generally regarded as octahedral, Table 3.
|
Complex |
ν1 |
ν2 |
ν3 |
ν2/ ν1 |
ν1/ν2 |
Δ/B |
Ref |
|---|---|---|---|---|---|---|---|
| V3+ in Al2O3 |
17400 |
25200 |
34500 |
1.448 |
0.6906 |
30.90 |
13 |
| [VCl3(MeCN)3] |
14400 |
21400 |
? |
1.486 |
0.6729 |
28.68 |
4 |
| K3[VF6] |
14800 |
23250 |
? |
1.571 |
0.6365 |
24.78 |
4 |
Interpretation of the spectrum highlights the difficulty of using the right-hand side of the Orgel diagram as previously noted. For d2 cases where none of the transitions correspond exactly to Δ often only 2 of the 3 transitions are clearly observed and hence the calculations will have three unknowns (Δ, B and C.I.) but only 2 energies to use in the the analysis.
The first transition can be unambiguously assigned as:
3T2g ← 3T1g transition energy = 4/5 * Δ + C.I.
But, depending on the size of the ligand field ( Δ) the second transition may be due to:
3A2g ← 3T1g transition energy = 9/5 * Δ + C.I.
for a weak field or
3T1g(P) ← 3T1g transition energy = 3/5 * Δ + 15B' + 2 * C.I.
for a strong field.
The transition energies of these terms are clearly different and it is often necessary to calculate (or estimate) values of B, Δ and C.I. for both arrangements and then evaluate the answers to see which fits better.
The difference between the 3A2g and the 3T2g (F) lines should give Δ. In this case Δ is equal to either:
25200 - 17400 = 7800 cm-1
or 34500 - 17400 = 17100 cm-1.
Given that we expect Δ to be greater than 15000 cm-1 then we must interpret the second transition as to the 3T2g(P) and the third to 3A2g. Further evaluation of the expressions then gives C.I. as 3720 cm-1 and B' as 567 cm-1.
Solving the equations like this for the three unknowns can ONLY be done if the three transitions are observed. When only two transitions are observed, a series of equations[14] have been determined that can be used to calculate both B and Δ. This approach still requires some evaluation of the numbers to ensure a valid fit. For this reason, Tanabe-Sugano diagrams become a better method for interpreting spectra of d2 octahedral complexes.
Using Tanabe-Sugano diagrams
The use of Orgel diagrams allows a qualitative description of the spin-allowed electronic transitions expected for states derived from D and F ground terms. Only 2 diagrams are needed for high spin d2-d9 and both tetrahedral and octahedral ions are covered.
Tanabe-Sugano diagrams were developed in the 1950's to give a semi-quantitative approach and include both high and low spin ions and not only the spin-allowed transitions are shown but the spin-forbidden transitions are displayed as well.
At first glance they can appear quite daunting, but in practice they are much easier to use for interpreting spectra and provide much more information. The obvious differences are the presence of the additional lines and that the ground state is shown as the base line along the X axis rather than as a straight line or curve originating from the Y axis.
On the X axis Δ/B' is plotted while on the Y axis E/B' is plotted, where B' is the modified Racah B parameter that exists in the complex.
A separate diagram is needed for each electronic configuration d2-d9 and for the d4-d7 cases both the high spin and low spin electronic configurations are shown. The high spin is on the left-hand-side of the vertical line on the diagram.
For the d2 case where it is difficult to use an Orgel diagram, the TS diagram is shown below. The ground state is 3T1g which is plotted along the base line.
Note that the transitions that occur are dependent on the sizes of Δ and B and the A2g term may be either higher or lower than the T1g (P) term (depending on whether Δ/B' is greater than about 15).
For the V(III) aqua ion, transitions are observed at 17,200 and 25,600 cm-1 which are assigned to the 3T2g ← 3T1g and 3T1g(P) ← 3T1g (F) respectively.
Interpretation requires taking the ratio of these frequencies and then finding the position on the diagram where the height of the 3T1g(P) / 3T2g exactly matches that ratio.
For a ratio of 1.49, this is found on the diagram below at Δ/B' of 28.0.
Reading off the position on the Y axis for the three spin-allowed lines gives E/B' values of 25.9, 38.6 and 53 (3T2g, 3T1g and 3A2g)
To determine the value of Δ and B' is now relatively straightforward since from the first transition energy of 17,200 cm-1 and the value of E/B' of 25.9 we can equate B' as:
B' = 17,200/ 25.9 or B' = 665 cm-1
Alternatively from the second transition energy of 25,600 cm-1 and the value of E/B' of 38.6 we can equate B' as:
B' = 25,600/ 38.6 or B' = 663 cm-1 which is in excellent agreement with the value found from the first transition.
The value of Δ can then be determined from the Δ/B' ratio of 28.0 and the value just calculated for B' of 665 cm-1.
This gives Δ as 28.0 x 665 = 18,600 cm-1
The transition 3A2g ← 3T1g would be predicted to occur at 53 x 665 that is 35,245 cm-1 (or 284 nm) which is in the UV region and not observed. (Possibly obscured by charge transfer bands).
The values of Δ and B' can be compared to similar V(III) complexes and it should be noted that in general for M(III) ions the Δ value is often about 3/2 times the value expected for M(II) ions.
The free ion value of B for a V(III) ion is 860 cm-1 and the reduction of this value noted for the observed B' is a measure of what is described as the Nephelauxetic Effect.
The Nephelauxetic Effect
The Racah repulsion parameters for a metal complex vary as the ligand is changed
- As the complex becomes more covalent the electrons are to some extent spread over the ligands so the electron-electron repulsion is reduced
- This reduction in repulsion as covalency increases is called the nephelauxetic effect (literally "cloud expanding")
A nephelauxetic series can be set up based on the variation of the Racah parameter.
A large reduction in B (free ion) indicates a strong Nephelauxetic Effect.
{B(free ion)- B'(Complex)} / B(free ion)
The Nephelauxetic Series is given by:
F- < H2O < urea < NH3 < en ~ C2O42- < NCS- < Cl- ~ CN- < Br- < S2- ~ I-
This series is consistent with fluoride complexes being the most ionic and giving a small reduction in B while covalently bonded ligands such as I- give a large reduction of B.
N.B. The order of the nephelauxetic series is NOT the same as the spectrochemical series as one is an indication of B and the other of Δ
As an example of a Cr(III) complex, using the observed peaks found for [Cr(NH3)6]3+ in Table 1 above, namely ν1 = 21550 cm-1 and ν2 = 28500 cm-1 the ratio of ν2/ν1 = 1.32.
The value of Δ is obtained directly from the first transition so Δ/B' is equal to ν1/B' and finding B' is now relatively straightforward since from the first transition energy of 21,550 cm-1 and the value of Δ/B' (ν1/B') of 32.6 we get:
B' = 21,550/ 32.6 or B' = 661 cm-1
The third peak can then be predicted to occur at 69.64 * 661 = 46030 cm-1 or 217 nm (well in the UV region and probably hidden by charge transfer or solvent bands).
It is important to remember that for spectra recorded in solution the width of the peaks may be as large as 1-2000 cm-1 so as long as it is possible to unambiguously assign peaks, the techniques are valuable.
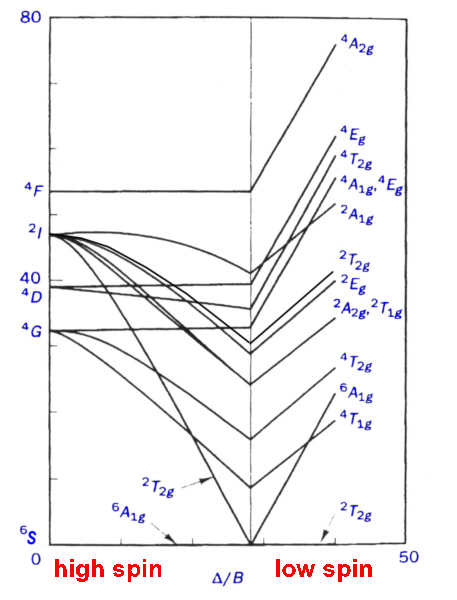
high-spin octahedral d5 case and low-spin complexes
For Mn(II) and other d5 cases, the ground state is 6S and higher states include, 4G, 4D, 4P 4F etc.
It is expected that since there are NO spin-allowed transitions possible, the electronic spectrum should only contain very weak bands. For the other electronic configurations spin-forbidden bands are rarely observed since they are hidden by the more intense spin-allowed transitions. Since there are now no spin-allowed transitions, by amplifying the signal and using concentrated solutions, a number of weak peaks can be seen.
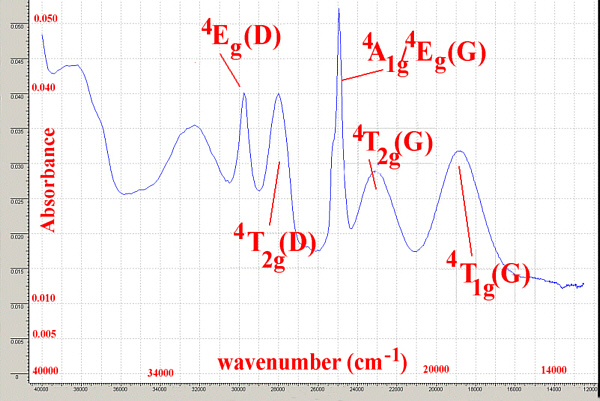
The Tanabe-Sugano diagram can be used to interpret these bands by once again calculating the ratio of the energies of 2 peaks and finding that position on the diagram.