
21.5: The Spectra of Molecules- Infrared
- Page ID
- 49640

When we turn from the spectra of atoms to those of molecules, we find that the region of most interest to chemists is no longer the visible and ultraviolet but rather the infrared. As its name implies, the infrared extends beyond the red end of the visible spectrum, from the limit of visibility at roughly 0.8 μm (800 nm) up to about 100 μm where the microwave region begins. Another difference from the spectra discussed in the atomic spectra section is that infrared spectra are all absorption spectra rather than emission spectra. Infrared light is passed through the sample, and the intensity of light emerging is measured electronically. The energies of infrared photons are very much less than those of visible and ultraviolet photons. A photon of wavelength 10 μm has an energy of only 0.02 aJ (about 12 kJ m–1)—not even enough to break a hydrogen bond, let alone a normal covalent bond. It does have enough energy to make a molecule vibrate more strongly, however, and since vibrational energy is quantized, this can only happen at certain discrete frequencies and not at others.
Figure 1 shows the infrared spectra of two triatomic molecules, H2O and CO2, and also that of a more complex molecule, C2H5OH (ethanol). Each of the peaks in these spectra corresponds to a strong absorption of infrared radiation on the macroscopic level and a sudden increase in the amplitude with which the molecule vibrates on the microscopic level. Since a polyatomic molecule can vibrate in a variety of ways, there are several peaks for each molecule. The more complex the molecule, the larger the number of peaks. Note also that not all the vibrations correspond to the stretching and unstretching of bonds. A vibration in a polyatomic molecule is defined as any periodic motion which changes the shape or size of the molecule. In this sense bending and twisting motions also count as vibrations.

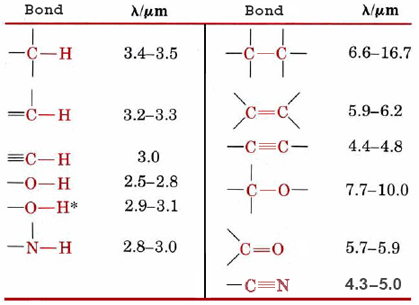
A useful feature of the vibrations which occur in polyatomic molecules is that many bonds and some small groups of atoms vibrate in much the same way no matter what molecule they are in. In Figure 1, for example, stretching of the O—H bond gives a peak between 2 and 3 μm for both H2O and C2H5OH. Because of this it is possible to identify many of the functional groups in an organic molecule merely by looking at its infrared spectrum. Figure \(\PageIndex{2}\) shows characteristic wavelengths by which some common functional groups can be identified. On the other hand, each molecule is a unique combination of chemical bonds and functional groups. Quite minor differences in molecular structure can result in noticeable differences in the infrared spectrum. Thus these spectra can be used in the same way the police use fingerprints.
When an unknown compound is prepared, one of the first things that is usually measured is its infrared spectrum. If this spectrum should happen to match that of a previously prepared compound, the unknown compound can be readily identified. If not, it may still be possible to identify some of the functional groups that are present.
In order for a molecular vibration to interact with electromagnetic radiation, the dipole moment of the molecule must change as the vibration takes place. The larger this change in dipole moment, the more strongly the substance absorbs the incident radiation. Thus very polar bonds like O—H and C==O usually produce very prominent peaks in an infrared spectrum. Conversely some vibrations do not feature in the infrared at all. In particular, diatomic molecules like N2 and O2, in which both atoms are identical, have zero dipole moment at any stage in a vibration. They produce no absorption in the infrared.
Since N2 and O2, are the chief constituents of the air, it is just as well that they do not absorb infrared radiation. The atmosphere would become intolerably hot if they did! As it is, only the minor constituents of the atmosphere, CO2 and H2O, absorb in the infrared. Nevertheless this absorption still plays an important role in maintaining the surface of the earth at its current temperature.
The earth absorbs energy from the sun by day, and radiates this energy away at night. The inflow and outflow must balance on average, otherwise the earth would heat up or cool down. Most of the sun’s radiation is in the visible region of the spectrum, but the radiation which escapes from the much cooler earth is mainly in the infrared, centered around 10 to 12 μm. As you can see from Figure \(\PageIndex{1}\), water absorbs infrared radiation between 2 to 3 μm and 6 to 7.5 μm. Water also absorbs strongly above 18 μm. Thus much of the outgoing infrared radiation is absorbed by water vapor in the earth’s atmosphere and prevented from escaping. You may have noticed that after a really humid summer day the temperature does not fall very fast at night. Excess water vapor in the atmosphere prevents radiation from escaping the earth’s surface. On the other hand, in a desert area the low humidity allows rapid heat loss. Although rocks may become hot enough to fry an egg by day, temperatures often drop to freezing overnight. While local concentrations of water vapor may vary from time to time, the total quantity in the earth’s atmosphere is buffered by the vast areas of ocean and remains nearly constant. Thus the average absorption of outgoing radiation by water seldom changes. The quantity of CO2 in the atmosphere is not so well regulated, however, and it appears that human activities are causing it to increase. (Using the data provided in Example 4 of Equations and Mass Relationships, you can calculate that about 9.4 Pg (9.4 × 10¹⁵ g) of CO2 results from the combustion of fossil fuels in the world each year.) Even in a relatively non- industrial area such as Hawaii, there has been a steady increase in CO2 concentration for many years.
Referring to Figure \(\PageIndex{1}\) again, we can clearly see that infrared absorption by CO2 occurs in just those parts of the spectrum that were not blocked by H2O absorption. Thus increasing the concentration of CO2 should decrease earth’s radiation to outer space and might increase the average surface temperature. On a global scale this is called the greenhouse effect—the CO2 and H2O act like the glass in a greenhouse, allowing visible light to pass in but blocking the loss of infrared. Climatologists have predicted that during the hundred years human beings have been using fossil fuels, the greenhouse effect should have raised surface temperatures by 0.5 to 1.0 K. Until 1950 that prediction appeared to have been borne out, but measured temperatures have since fallen back to about the 1900 level. Attempts to explain this drop on the basis of additional particulate matter in the atmosphere have met with varying degrees of success and failure. All that can be said for certain is that we know far less about the atmosphere and world climate than we would like.