6.6: Ionization Energies
- Page ID
- 49349

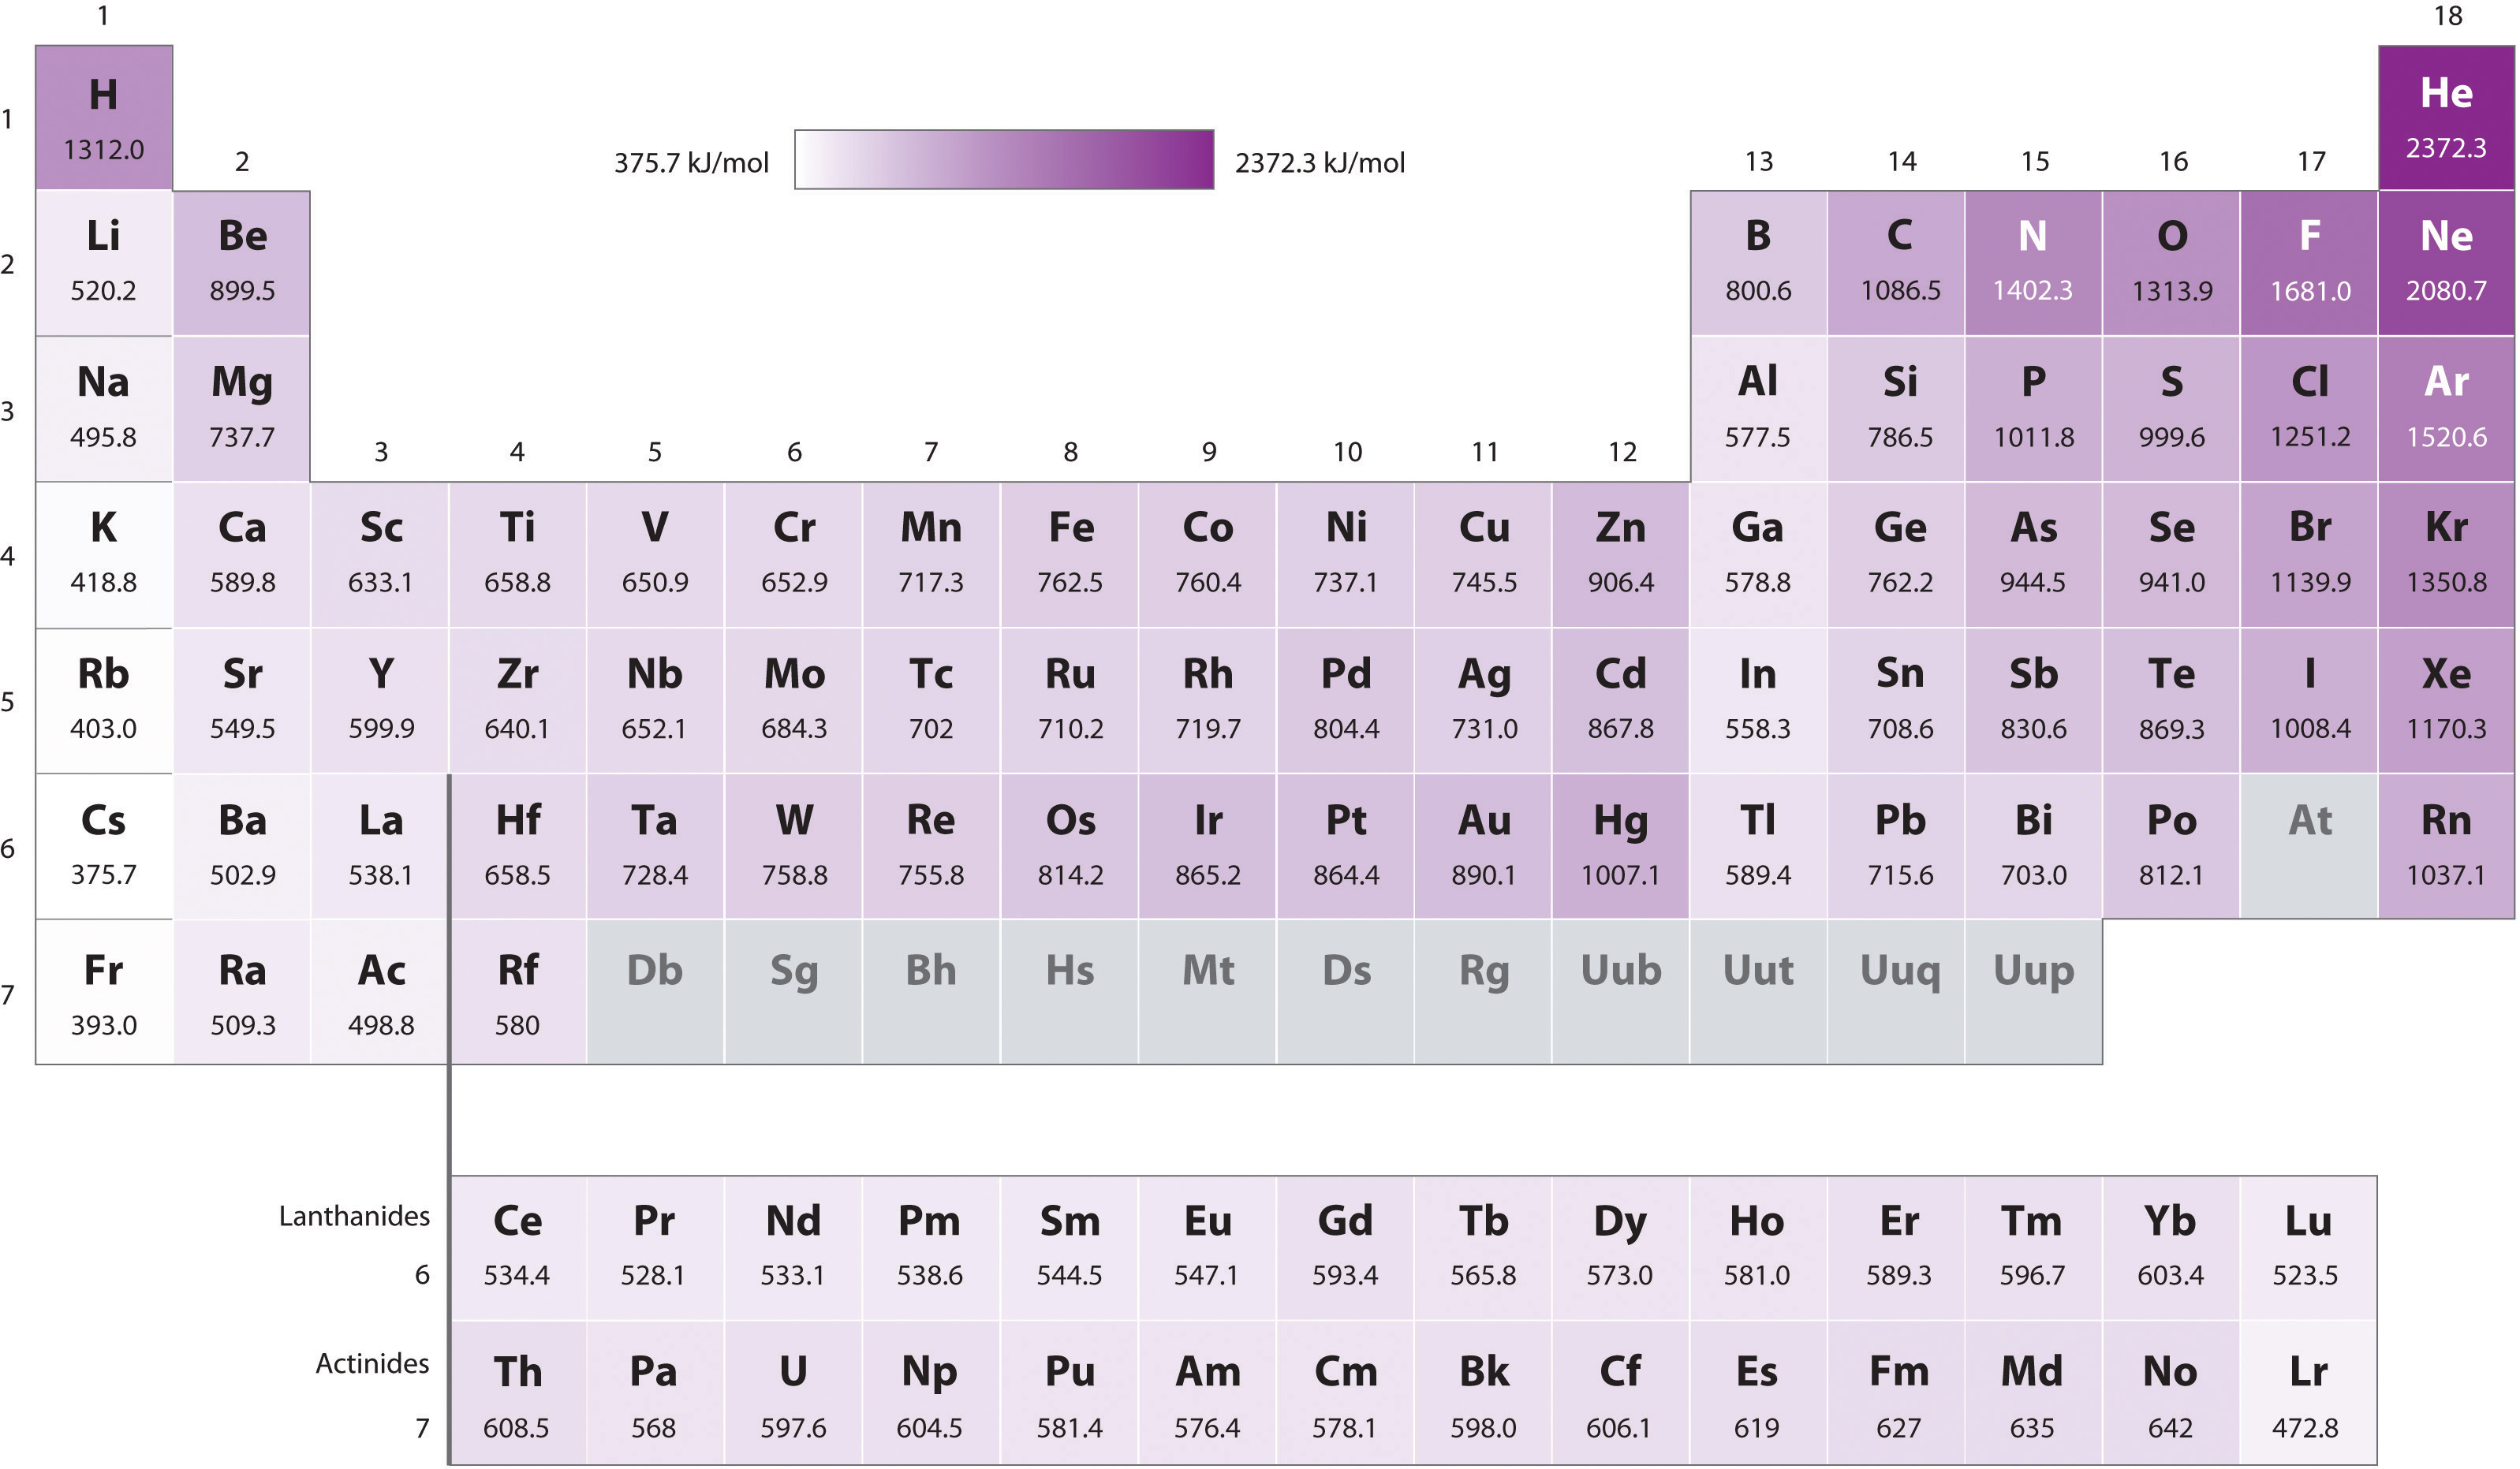
Figure \(\PageIndex{1}\) plots the the ionization energies of the elements are plotted against atomic number. An obvious feature of this figure is that the elements with the highest ionization energies are the noble gases. Since the ionization energy measures the energy which must be supplied to remove an electron, these high values mean that it is difficult to remove an electron from an atom of a noble gas.

A second obvious feature is that the elements with the lowest ionization energies are the alkali metals. This means that it is easier to remove electrons from atoms of this group of elements than from any other group. Closer inspection also reveals the following two general tendencies:
- As one moves down a given group in the periodic table, the ionization energy decreases. In group I, for example, the ionization energies decrease in the order Li > Na > K > Rb > Cs. The reason for this is a steady increase in size of the valence electron cloud as the principal quantum number n increases. The 6s valence electron of Cs, for instance, is further from the nucleus and hence easier to remove than the 5s valence electron of Rb.
- As one moves from left to right across the periodic table (from an alkali-metal atom to a noble gas), the ionization energy increases on the whole. In such a move the n value of the outermost electrons remains the same, but the nuclear charge increases steadily. This increased nuclear attraction requires that more work he done to remove an electron, and so ionization energy goes up.
One can confirm these general trends by inspecting Figure \(\PageIndex{1}\). As one moves from He to Ne to Ar one can see marked decreases in the ionization energy, confirming the trend of decreasing ionization energy as you move down a group. Moving from left to right across the periodic table produces an increase in the ionization energy, as can be observed by the upward trend as you go from Li to Ne.
Ionization energies can be measured quite accurately for atoms, and the values obtained show some additional features which are less important than the two major trends mentioned above. For example, consider the data for elements in the second row of the periodic table. Numerical values for the relevant ionization energies are shown in Figure \(\PageIndex{2}\) of ionization energies and electron affinities below.
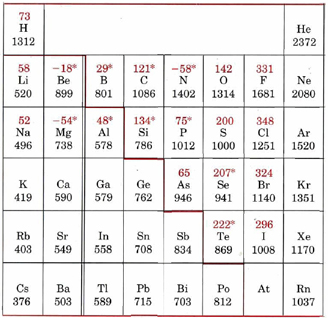
The general trend of increasing ionization energy across the table is broken at two points. Boron has a smaller value than beryllium, and oxygen has a smaller value than nitrogen. The first break occurs when the first electron is added to a p subshell. As was mentioned several times in the previous chapter, a 2p electron is higher in energy and hence easier to remove than a 2s electron because it is more efficiently shielded from the nuclear charge. Thus the 2p electron in boron is easier to remove than a 2s electron in beryllium.
The second exception to the general trend occurs in the case of oxygen, which has one more 2p electron than the half-filled subshell of nitrogen. The last electron in the oxygen atom is forced into an already occupied orbital where it is kept close to another electron. The repulsion between these two electrons makes one of them easier to remove, and so the ionization energy of oxygen is lower than might be expected.
These discontinuities also appear periodically, as would be expected since they arise from the structure of the valence electrons. Sulfur and selenium, in the same group as oxygen, show the discontinuity in the trend of increasing ionization energy, which arises from the same half-filled subshell effect. Aluminum and gallium, both in the same group as boron, similarly show a decrease in ionization energy compared to magnesium and calcium.
While this trend does not seem to apply for indium, and thallium, it is important to remember that the chart is missing the transition metals. Looking at the graph of ionization energies, it is clear that indium(atomic number 49) does have a lower ionization energy than cadmium (atomic number 48), and the same is true of mercury, the element preceding thallium (atomic number 81).
Below is a full periodic table, with shading to demonstrate the periodic trend of ionization energy. The darker the shading, the higher the ionization energy. Notice the general trend of increasing darkness (or ionization energy) as one moves to the right and up. Take a moment to write down why this is so.