
Example Results and Discussion
- Page ID
- 59704

Figure 1 shows representative data obtained by students from a commercially available cigarette brand. An electrolyte blank (nominally free of Cd and Pb) was performed prior to running the sample and was used for background subtraction. Small, but clearly visible Cd and Pb peaks (occurring at -0.65V and -0.45V respectively) indicate that both cadmium and lead were present in the solution sample (a 1 mL aliquot of the cigarette extract in 20 mL of the CLAC electrolyte). Four successive standard additions (“spikes”) of 3.0 μL of 10 ppm Cd/Pb standard were then executed. The expected increase in peak area and height were observed during the spiking procedure.
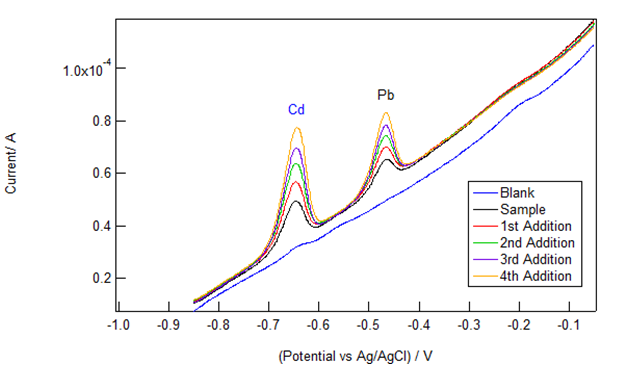
Figure 1 Voltammograms (different colored traces) from a representative cigarette sample and four successive standard additions of a mixed 10 ppm Cd and Pb standard. The peak at -0.65 V is from Cd2+ and the one at -0.45 V is due to Pb2+.
The standard addition extrapolation method was applied by the VAS software and also via extraction of the peak area data from VAS followed by analysis in IGOR Pro 6.34A as shown in Figure 2. (We ask the students to conduct the analysis and present the data in Excel so that they can do an error analysis using the Regression in the Data Analysis Toolpak, available from the Excel AddIns.) Linear plots of the peak area against the total concentration of Cd/Pb standard added to the sample were obtained and the slope and y-intercept are shown on the graph – note that it is the x-intercept (or rather its absolute value) that is equal to the unknown concentration in this case. The 95% confidence level concentrations of Cd and Pb in the extract (obtained by adjusting for dilution) were 9.68 ±0.34 ppb and 11.09 ±0.64 ppb. These concentrations were well above the statistical limits of detection (3 times the standard error of the blank) of 0.42 ppb for cadmium and 0.33 ppb for lead and limits of quantitation (10 times the standard error of the blank) of 1.4 ppb for cadmium and 1.1 ppb for lead. The obtained extract concentrations imply that the cigarettes contained 97 ng of Cd and 111 ng of Pb (specified extract relative concentration as ng/mL times 20 mL volume of extract divided by 2 cigarettes).
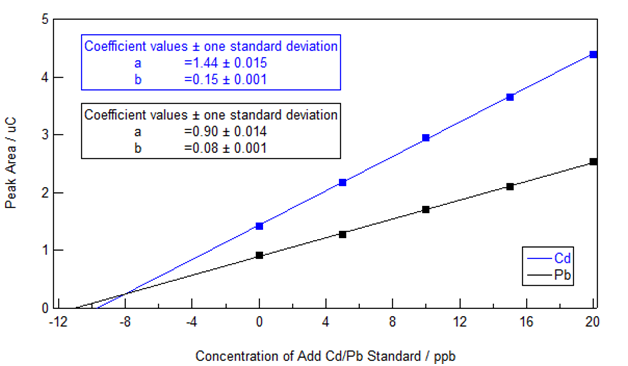
Figure 2 Standard Addition plot showing Cd and Pb peak area vs. the total concentration of Cd and Pb added to the cigarette sample solution.
The actual method detection limits are probably higher than the analytical LoD quoted above when sampling and the extraction recovery uncertainties are considered. To optimize the measurement for lower levels of metals, a larger quantity of sample (i.e., using more cigarettes) could be extracted. Additionally, ASV electrodeposition time can be increased and/or square-wave or differential pulse scan methods can be implemented, but these steps were unnecessary for many of the cigarette samples that were tested. Both of the latter alternative stripping methods provide higher sensitivity and better resolution than the linear-scan method, but the square-wave method has a higher throughput. In separate experiments in our laboratory, the square-wave stripping method was observed to provide a ten-fold improvement in signal-to-noise ratio and a commensurate lowering of the detection limit. Advanced students that were designing their own experiments (the Active Learning variant) can implement these options without much difficulty using the VAS software.