
Results and Discussion
- Page ID
- 60483

Device fabrication.
In the first implementation of the microchip CE experiment in 2008, we had the students bond their own devices using a PMMA piece having hot-embossed channels and another PMMA substrate with laser-cut reservoir holes. Of the three laboratory groups that carried out the experiment that year, one team succeeded in making a working CE microchip on their initial bonding attempt on the first day of the experiment (see Figure 3), one team had an operable CE microdevice after their second bonding try late in day one of the experiment, and a final team was unable to fabricate a working CE microchip during the full three laboratory periods allotted. We were very much encouraged by the two groups that succeeded in constructing usable devices in one laboratory period, because they demonstrated that undergraduates and first year graduate students could readily make workable microfluidic systems, even if they have fairly limited training. However, we found that the time expended in making devices left less than the desired amount of time to study and learn about microfluidic phenomena using these microchips. Thus, the focus in subsequent years was shifted from device fabrication to device usage. Instructions to students regarding device bonding (from an older version of the laboratory writeup) are included as part of the electronic materials accompanying this document.
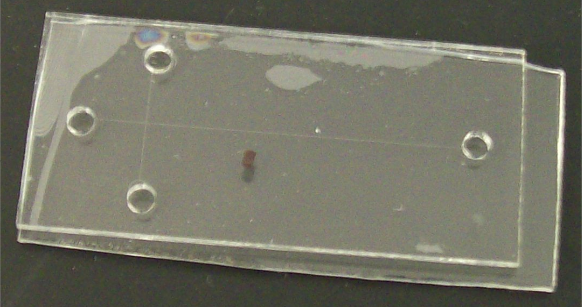
Figure 3. Photograph of a CE microchip fabricated by students in the instrumental analysis laboratory. The device is about 2 cm x 5 cm. The black marker “1” in the middle of the device indicates that this was their first device.
We had also initially planned to have students evaluate the fabrication of CE microchips using a solvent bonding approach we developed.13 As we tried to adapt this procedure for the laboratory experiment, we found it to be more time consuming and less reliable (in terms of device fabrication success), than the thermal bonding approach we ended up using. We note that the solvent-bonded devices allow higher voltages to be applied than thermally bonded microchips,13 so they could potentially be used in this experiment if the fabrication can be streamlined appropriately.
Experimental data.
The microchip CE laboratory provides students with considerable opportunity to obtain and evaluate data from these microdevices. Figure 4 shows a microchip electropherogram from a student team that did the experiment in 2008. Although the amino acid peaks are clearly visible in the plot, the students also detected several impurity peaks. Because the purity of the FITC-labeled samples was less than desired, in subsequent experiments, the sample quality was evaluated carefully before students attempted the laboratory. Indeed, the data from a 2009 team’s laboratory work on the identification of the amino acid components of an unknown mixture (Figure 5) showcases both the much improved sample purity and the separation reproducibility. These electropherograms demonstrate the type of data that can be obtained in a classroom setting using this laboratory experiment.
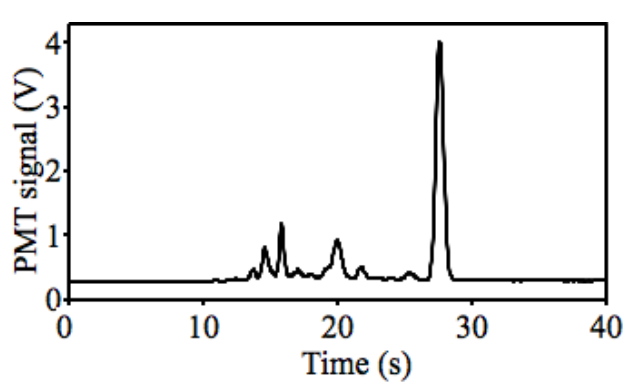
Figure 4. Microchip electropherogram of an amino acid mixture obtained by a student group in the instrumental analysis laboratory, using the device shown in Figure 3.
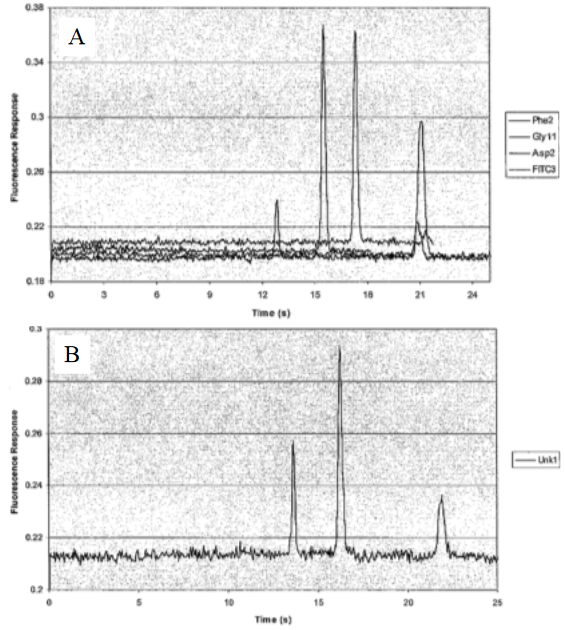
Figure 5. Student microchip electropherograms used in identifying an amino acid mixture. (A) Individual runs of FITC-Asp, FITC-Gly, FITC-Phe and FITC. (B) Electropherogram of the unknown mixture; peaks are (in elution order) FITC-Asp, FITC-Gly and FITC.
In addition to obtaining electropherograms, students can also use the experimental data to determine numbers of theoretical plates and gain information about separation performance from those results. For example, Figure 6 shows student data plotting the number of theoretical plates in a separation as a function of “pinched” injection time. The “pinched” injection scheme is designed to provide a time-independent injection volume. The student data agree with expectations, as the number of theoretical plates appears to plateau after ~60 seconds injection time. Furthermore, students can use the flexibility of the experimental platform to study the effect of microchip CE separation distance on performance (at constant overall applied voltage). Figure 7 shows student data that indicate a linear correlation between separation distance and number of theoretical plates in microchip CE. We note that for standard CE the number of theoretical plates depends only on the separation voltage, because the detection position is fixed, usually at the end of the column. With our platform, we can position the detector anywhere along the separation channel, and the number of theoretical plates (at constant overall applied potential) is expected to depend linearly with the distance to detection, in accord with student results. Thus, the microchip CE experiment offers a more in-depth exposure to separation phenomena.
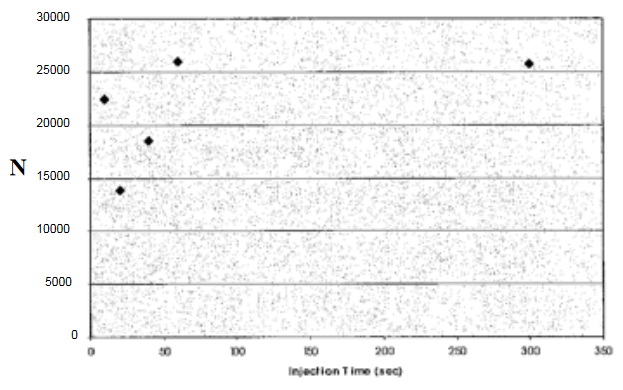
Figure 6. Student plot of number of theoretical plates (N) vs. “pinched” injection time.
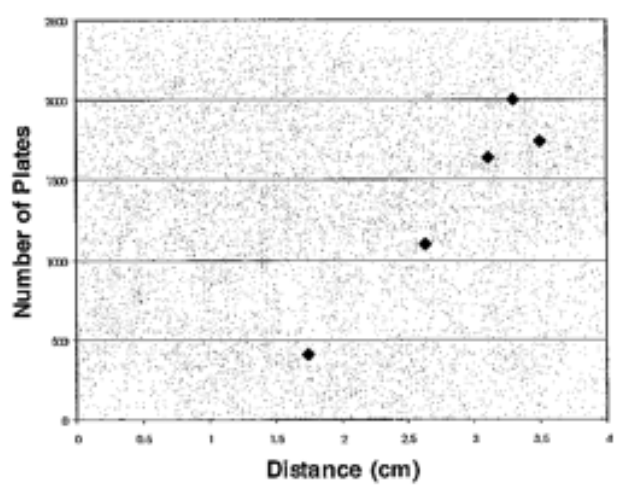
Figure 7. Student plot of number of theoretical plates as a function of distance to detection in microchip CE at constant separation voltage. The data follow a linear trend, in accord with expectations.