Decibel Scale
- Page ID
- 77529

\( \newcommand{\vecs}[1]{\overset { \scriptstyle \rightharpoonup} {\mathbf{#1}} } \) \( \newcommand{\vecd}[1]{\overset{-\!-\!\rightharpoonup}{\vphantom{a}\smash {#1}}} \)\(\newcommand{\id}{\mathrm{id}}\) \( \newcommand{\Span}{\mathrm{span}}\) \( \newcommand{\kernel}{\mathrm{null}\,}\) \( \newcommand{\range}{\mathrm{range}\,}\) \( \newcommand{\RealPart}{\mathrm{Re}}\) \( \newcommand{\ImaginaryPart}{\mathrm{Im}}\) \( \newcommand{\Argument}{\mathrm{Arg}}\) \( \newcommand{\norm}[1]{\| #1 \|}\) \( \newcommand{\inner}[2]{\langle #1, #2 \rangle}\) \( \newcommand{\Span}{\mathrm{span}}\) \(\newcommand{\id}{\mathrm{id}}\) \( \newcommand{\Span}{\mathrm{span}}\) \( \newcommand{\kernel}{\mathrm{null}\,}\) \( \newcommand{\range}{\mathrm{range}\,}\) \( \newcommand{\RealPart}{\mathrm{Re}}\) \( \newcommand{\ImaginaryPart}{\mathrm{Im}}\) \( \newcommand{\Argument}{\mathrm{Arg}}\) \( \newcommand{\norm}[1]{\| #1 \|}\) \( \newcommand{\inner}[2]{\langle #1, #2 \rangle}\) \( \newcommand{\Span}{\mathrm{span}}\)\(\newcommand{\AA}{\unicode[.8,0]{x212B}}\)
Expressing Signal Attenuation of RC filters
- Because an ideal analog filter would not attenuate the signal but only the noise, the decibel scale is used to express the degree of electrical attenuation (or gain) attributable to an electronic device, such as a RC filter.
- A decibel is defined as: \[\mathrm{dB = 20 \log_{10} \left(\dfrac{V_{out}}{V_{in}}\right)}\]
- So 0 dB represents no signal attenuation, and -20 dB represents an order of magnitude decrease in the RC filter output compared with the input.
- Remember that S/N enhancement is possible if the frequency of the signal and the noise are different. We can express the attenuation of the RC filter response as a function of frequency using a Bode plot.
- Bode plots are log-log plots: decibels are a logarithmic quantity and frequency is plotted on a logarithmic scale. They are quite frequently used to illustrate the frequency response of electronic circuits.
Bode Plots
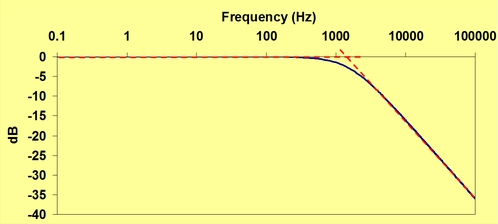
- Below is a Bode plot of the low-pass RC filter frequency response shown a few sections back. Notice that low frequencies are unattenuated, but attenuation increases with higher frequencies.
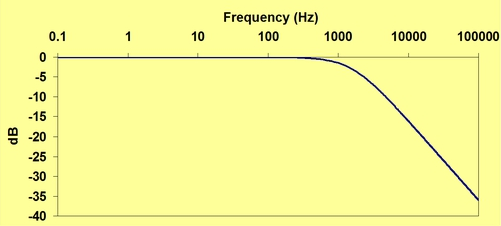
- Every Bode plot has two straight lines: the relatively flat response where little attenuation occurs and a linear response of -20 dB/decade at higher frequencies. The intersection point of these two lines coincides with the rounded section of the plot. This is the cutoff frequency, f0, of the RC filter, which is expressed by the following relationship: f0 = 1/(2πRC)
The cutoff frequency, which is 1592 Hz for this particular circuit, corresponds to a 3 dB attenuation, and can be used as a figure-of-merit for the response of the filter.
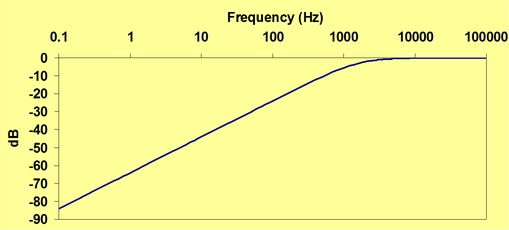
- Below is a Bode plot of the high-pass RC filter frequency response a few sections back. Note that because the same resistor and capacitor were used, the cutoff frequency has not changed. The filter output is simply accessed across the resistor instead of the capacitor.