
Part III: Ways to Summarize Data
- Page ID
- 81340

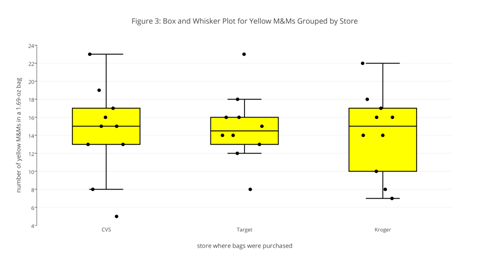
Although box and whisker plots, dot plots, and histograms help us see qualitative patterns in our data, they do not allow us to express this information in a quantitative way. For example, in Figure 3 and in Investigation 10 we learned that the distribution of yellow M&Ms in 1.69-oz bags is relatively similar between the three different sources, although the plot for samples purchased from Target has much shorter whiskers and the individual results seem more tightly clustered than is the case for samples purchased at CVS and at Kroger, and the box for the samples purchased from Kroger is quite a bit wider than is the case for the samples from CVS and Target.
Qualitative phrases such as “relatively similar,” “much shorter,” “more tightly clustered,” and “quite a bit wider” are, frankly, fuzzy, but in the absence of a more quantitative way to characterize our data, we have little choice but to adopt such fuzzy terms. When we summarize data, our goal is to report quantitative characteristics, or statistics, that we can use to provide clearer statements about the differences and the similarities between results for different variables, or between the results for a variable and an expected result already known to us. In this part of the case study we consider several useful statistics that we can use to summarize the data for our samples.
Before we consider ways to summarize our data, we need to draw a distinction between a sample and a population. We collect and analyze samples with the hope that we can deduce something about the properties of the population. Using our data for M&Ms as an example, define the terms sample and population.
Both a box and whisker plot and a histogram suggests that the distribution of results for a single variable has two important features: its center, which presumably lies somewhere in the middle of the data, and its spread, which is suggested by the length of the whiskers in a box and whisker plot, or how quickly or how slowly the counts in a histogram’s bins decrease as we move away from the bin that has the most counts. For our purposes, we will consider two quantitative measures of central tendency—the mean and the median—and four quantitative measures of spread: the variance, the standard deviation, the range, and the interquartile range.
Central Tendency. The mean, \(\bar{x}\), is the arithmetic average of all n of a variable’s results; thus
\[\bar{x}=\dfrac{\sum x_i}{n}\]
where xi is the result for an individual sample. The median is the middle value when the n results are ordered by rank from smallest-to-largest. If n is odd, then the median is the (n + 1)/2th; if n is even, then the median is the average of the (n / 2)th value and the ((n ⁄ 2 ) + 1)th value.
Using the data for yellow M&Ms, calculate the mean and the median for each store and discuss your results. If the mean and the median are equal to each other, what might you reasonably conclude about your data? If the mean is larger than the median, or if the mean is smaller than the median, what might you reasonably conclude about your data? A measure of central tendency is considered robust when it is not changed by one or more results that differ substantially from the remaining results. Which measure of central tendency is more robust? Why?
Spread. A sample’s variance, s 2, provides an estimate of the average squared deviation of its n results relative to its mean; thus
\[s^2 =\dfrac{\sum (x_i-\bar{x})^2}{n-1}\]
where xi is the result for an individual sample and \(\bar{x}\) is the variable’s mean value. The standard deviation, s, is the square root of the variance.
The range is the difference between the sample’s largest value and its smallest value. A variable’s interquartile range, IQR, spans the middle 50% of its values. To find the IQR, we order the data from smallest-to-largest, and separate it into two equal parts; if the sample has an odd number of values, then we do not include the median in either part. Next, we find the median for each of the two parts. The IQR is the difference between these two medians. Note: There actually are several methods for calculating the IQR, which differ in how they divide the data into four parts. As you might expect, different methods may result in different values for the IQR. The method described here was used to create the box and whisker plots in Figures 1–3, where the width of the box is the interquartile range.
Using the data for yellow M&Ms, calculate the variance, the standard deviation, the range, and the IQR for each store and discuss your results. Is there a relationship between the standard deviation, the range, or the IQR? A measure of spread is considered robust when its value is not changed by one or more values that differ substantially from the remaining values. Which measure of spread—the variance, the standard deviation, the range, or the IQR—is the most robust? Why? Which is the least robust? Why?