Electrochemistry: Fast Scan Cyclic Voltammetry in Drug-Seeking Rats
- Page ID
- 89607

Article: P.E.M. Phillips, G.D. Stuber, M.L.A.V. Heien, R.M. Wightman, and R.M. Carelli, “Subsecond dopamine release promotes cocaine seeking,” Nature, 2003, 422, 614-618.
This article describes the results of experiments using fast scan cyclic voltammetry to monitor dopamine release in the brains of drug-seeking rats. While students do not need any specific background in neuroscience to understand the article, they should be reminded to look up unfamiliar biological terms as needed. Additionally, it is important to discuss Q13 from the out-of-class assignment at the start of the in-class portion to ensure that the students understood the experimental design and key results reported in each figure. Q1 of the in-class questions assumes that the students have previously encountered common spectroscopic methods and mass analyzers for MS; if this is not the case, this question can be omitted.
Out-of-Class Questions
Many of the out-of-class questions are designed to encourage the students to familiarize themselves with the study and related neuroscience terminology (Q1-Q4, Q6-Q7, Q9).
Q1. What is the difference between tonic and phasic dopamine signaling?
From the abstract, tonic signaling occurs on a minute-to-minute timescale, while phasic signaling occurs on a subsecond timescale.
Q2. Look up any other unfamiliar words in the abstract. Then summarize this study in one complete sentence.
Two common terms that students need to research are ventral tegmental area and nucleus accumbens:
ventral tegmental area: a section of the midbrain composed of dopamine-containing neurons that are involved in drug-seeking and reward circuitry
nucleus accumbens: a section of the forebrain involved in reward, pleasure, and laughter as well as aggression and fear
I look for some aspect of the four underlined components of the sentence below when evaluating student summaries of the study:
This study investigated subsecond (or phasic) dopamine signaling in the nucleus accumbens using fast scan cyclic voltammetry (or electrochemical measurements) in rats engaged in drug taking.
Q3. How were the rats taught to self-administer cocaine? How was the cocaine delivered?
As described on p. 617, the rats were trained to self-administer cocaine during 2-h sessions during which they were presented with a lever illuminated by a cue light. When the rats pressed the lever, the cocaine dose was administered through a jugular catheter.
Q4. What stimulus accompanied cocaine delivery?
As described on p. 617, cocaine administration was accompanied by a change in lighting and “a continuous auditory tone”.
Q5. What were the working and reference electrodes in this study? Why wasn’t a counter/auxiliary electrode necessary?
As described on p. 617, the working electrode was a carbon fiber microelectrode and the reference electrode was Ag/AgCl.
The latter question is meant for classes that have discussed the use of microelectrodes previously. For the very small currents that pass through ultramicroelectrodes, ohmic losses are negligible, and a two-electrode system does not pose any problems to accurate measurement.
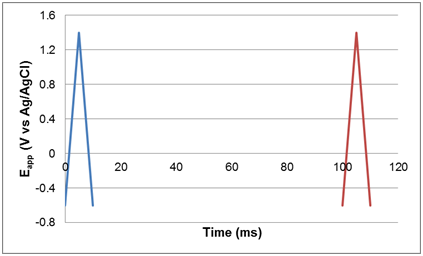
Q6. Sketch the potential applied to the working electrode as a function of time. Include as much detail in your plot as possible.
Students should label the time for each half-wave and the time between cycles in addition to the applied potentials. Some students may not initially realize that they can calculate these times from the maximum and minimum applied potentials (-0.6 V and +1.4V) and the scan rate (400 V/s), but usually at least one student in a group will identify this calculation. The potential on the electrode between scans is not specified in the manuscript. Students often assume that the potential is held at -0.6 V. The electrode was probably allowed to float (no current sourced or sunk) or may have been held at an unspecified potential relative to the reference. The plot below does not indicate the potential between scans.
Q7. How many cyclic voltammograms (scans) were acquired per second?
Scans were acquired at a frequency of 10 per second (one scan every 100 ms, as described on p. 617).
Q8. How does the scan rate in these experiments compare to a typical CV scan rate? How does scan rate usually affect CV data?
The scan rate for these experiments was 400 V/s. If students have performed a laboratory exercise on cyclic voltammetry, they can refer to the range of scan rates used (e.g., 100 mV/s to 1 V/s). Otherwise, this information may come from a previous lecture or their textbook. For example, p. 737 of the Skoog textbook gives a 50 mV/s scan rate as an example.
For reversible reactions, peak current (ip) increases linearly with the square root of the scan rate (v), as described by the Randles-Sevcik equation, \(i_p=2.686×10^5 n^{3/2} ACD^{1/2} v^{1/2}\).
Q9. How did the authors correct for current from interferents, movement of the animal, and pH changes in the extracellular space?
On page 617, in the methods section on fast-scan cyclic voltammetry, the authors note that artifacts from pH change or movement were correct by using a differential measurement was made between currents that occurred for dopamine oxidation at +0.7 V vs Ag/AgCl and another potential at which dopamine oxidation does not occur, but the interfering currents did.
This question, along with Q10, should highlight for the students the problem of selectivity at an unmodified electrode. Students should be referred to these questions as needed in their discussions of in-class Q3.
Q10. Complete the table below summarizing the means used to demonstrate that their signal came from dopamine release.
|
Experiment |
How did this demonstrate the signal was from dopamine release? |
|---|---|
|
anatomical |
Post-mortem histology was used to verify that the electrode was placed in the nucleus accumbens. |
|
physiological |
Electrical pulses were used to stimulate dopamine release and confirm its detection before and after each experiment. |
|
chemical |
Cyclic voltammograms recorded in the live animals were compared to CVs from in vitro standards. |
|
pharmacological |
An MAOI was administered to suppress the potential interferent, DOPAC, and no difference in signal intensity was observed. |
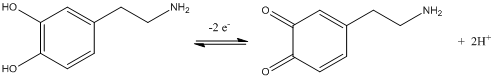
Q11. Draw the half-cell reaction for the oxidation of dopamine to dopamine quinone.
Q12. Consider the CV inset in Figure 1a. Label the oxidation and reduction half-waves. Was the oxidation of dopamine reversible? How can you tell?
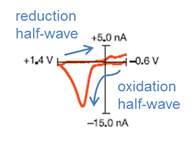
The oxidation was not reversible, as evidenced by the lack of current on the reduction half-wave.
Q13. Calculate the S/N ratio for the trace in Figure 3a.
This question is an opportunity for students to practice calculating SNR while also encouraging them to examine the data in a paper closely.
Measuring with a ruler, I estimate that the peak-to-peak noise is approximately 3/16” while the peak height is approximately ½”. Treating the peak-to-peak noise as roughly five times the rms noise gives
\[\dfrac{S}{N}=\dfrac{0.5}{0.2\left(\dfrac{3}{16}\right)}=13\]
Q14. Consider Figures 1-4. In the table, summarize the experimental design used for each experiment and the major results. In the column labeled stimulus/conditions, record what stimulus, if any, was used to elicit dopamine release or drug-seeking behavior. If no stimulus was used, note the conditions of the experiment. In the column labeled dopamine release, estimate the concentration of dopamine released in nM. In the column labeled timing, summarize any important findings about how the timing of the dopamine release related to the timing of the stimulus.
This question is helpful for the in-class discussion since it collects the most relevant points about each figure into one location. A quick check of student answers to this question is helpful before discussions start to ensure that the students are reading the figures correctly.
|
Figure |
Stimulus/Conditions |
Dopamine Release (nM) |
Timing of Response |
|---|---|---|---|
|
1 |
electrical stimulus train (24 pulses at 60 Hz) |
~700 nM |
Appears instantaneous, but not quantified in the text |
|
2 |
no stimulus, rats were seeking and obtaining cocaine by lever press |
64.9 ± 16.1 nM |
7.7 ± 0.6 s before lever press, small peak; |
|
3 |
audiovisual stimulus (no cocaine) |
93.9 ±12.2 nM |
peak starts at 0.1 ±0.5 s after stimulus |
|
4 |
electrical stimulus train (24 pulses at 60 Hz every 120 s) |
n/a |
animals had highest probability of lever-pressing 5-15 s after stimulus |
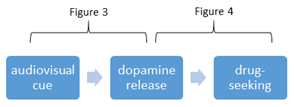
Notable features of the data summarized in this table are that there was a spike in dopamine before cocaine was actually administered (Figure 2), that a large dopamine response (comparable to the response from cocaine) was observed in the absence of drug simply by recreating the conditions of drug-use (Figure 3) and that dopamine release triggered drug-seeking behavior (Figure 4).
In-Class Questions
Q1. Suggest some advantages of electrochemical detection of dopamine for this application, compared to spectroscopic or mass spectrometric detection.
This question can be omitted in classes that have not covered spectroscopic and mass spectrometric methods. A major advantage is the ability to miniaturize electrodes for electrochemical detection for implantation into the brain of a rat. Because the measurements can be made in situ without derivatization or removing samples via microdialysis, the authors are able to achieve the temporal resolution needed for measurements of phasic dopamine signaling. The sensitivity of electrochemical detection, especially when miniaturized, is also an advantage since the dopamine concentrations are in the nanomolar range. Spectroscopic methods are often less amenable to miniaturization because of dependence of signal strength on path length.
Q2. Why was the cyclic voltammetry data not sufficient to identify the signal as coming from dopamine? (Why do the additional experiments that you summarized in out-of-class question #10?)
Refer students to out-of-class questions Q8 and Q9. Students who are unfamiliar with biological experiments may be surprised at the large number of controls needed. Additionally, this question is a useful opportunity to discuss the selectivity of electrochemistry at unmodified electrodes, which is often poor, and the use of controls or chemically modified electrodes to address this.
Q3. In Figure 1, where do the values for the color scale in the bottom panel come from? What plot would you obtain if you took a slice horizontally through the color plot? What would you obtain for a vertical slice?
This question is an opportunity for students to interpret 2D data plots requiring color mapping as a third dimension. Most students readily identify the color scale as representative of the current, but further thought and occasional prompting are required to answer the subsequent questions. The blue trace above the color map in Figure 1 is a horizontal slice. These slices show the current at a given potential as a function of time. If one chooses the correct potential, i.e., +0.7 V vs Ag/AgCl, this current is correlated with dopamine concentration, yielding a trace that shows the spike and subsequent decline in dopamine concentrations after the stimulus. The red cyclic voltammogram is a vertical slice through the data, folded back on itself. The continuous appearance of the data along the time axis is only possible because the authors used fast-scan cyclic voltammetry and were able to record a CV every 0.1 s (out-of-class Q6).
Q4. Suggest one software-based and one hardware-based method to improve the S/N or Figure 3a, and justify your choices.
This question is best suited for an instrumental class that has covered a variety of hardware and software methods to reduce noise. It may be helpful to quickly review hardware and software methods from earlier in the semester before the students begin their discussion of this question. Students can generate a list of hardware methods, such as grounding, shielding, hardware filters, lock-in amplifiers, etc. and a list of software methods, such as ensemble averaging, boxcar averaging, moving average, Fourier transform based filters, etc. In evaluating these possibilities, students should consider the fact that the goal is to collect data with high temporal resolution, which precludes extreme low-pass filtering. Additionally, students should consider that a rat brain is not a static, homogeneous system. Individual rats and even individual stimuli in the same rat may not consistently produce the same response. Instead, individual responses are likely to vary somewhat both in their timing and their magnitude.
Q5. Individuals recovering from drug addiction are often counseled to avoid “triggers”, including locations and situations in which they previously used drugs. Do the findings in this study support this advice? Why or why not? Cite a specific figure or figures in your answer.
Encourage students to build a logical progression from one dataset to the next, logically linking stimuli and responses, as shown below. Further conversation could include the limitations of animal models for complex human behaviors.