
Acid-Base Equilibria: Titrations of Bacterial Cell Surfaces
- Page ID
- 85407

Article: M. Dittrich and S. Sibler, “Cell surface groups of two picocyanobacteria strains studied by zeta potential investigations, potentiometric titration, and infrared spectroscopy,” J. Coll. Int. Sci. 2005, 286, 487-495.
This article presents an investigation of the surface chemistry of picocyanobacteria, which contribute to calcite precipitation in lakes. The article highlights a unique application of acid-base measurements while also encouraging students to think of the challenges presented by chemical investigations of live cells. Potentiometric titration is used to determine the pKa values of functional groups on the cells’ surface, and infrared spectroscopy is used to confirm identification of these groups. While the potentiometric titration plots look quite different from the titration curves students have seen in class, the same acid-base principles are used to interpret the data. When I use this paper in analytical chemistry, we skip the IR data so no questions on those sections are included; however, if the paper is read in a class that covers both techniques, questions on the second part of the paper could be added.
Out-of-Class Questions
Q1. Because this article deals with a microbiological and geochemical application, you need to familiarize yourself with a few terms. Match the following terms with their definitions/descriptions.
Students should have no trouble finding the definitions of these terms online:
__A__ autotropic
__J___ oligotrophic
__C__ pelagic
__B__ calcite
__L__ electrophoretic mobility
__K__ zeta potential
__F__ peptidoglycan
__H__ picocyanobacteria
__G__ picoplankton
__I__ Synechococcus
__D__ phycocyanin
__E__ phycoerythrin
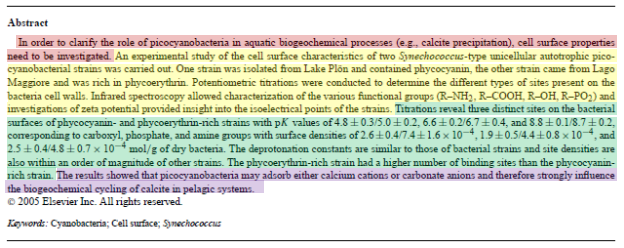
Q2. In the abstract of the article, mark which sentences correspond to (1) background information and significance, (2) methodological details, (3) results, and (4) conclusions.
There is some flexibility in the correct answer to this question, but a suggested mark-up is shown below: background and significance, methodological details, results, conclusions.
Q3. In your own words, describe why the surface chemistry of picocyanobacteria is an important area of research.
I typically look for some form of the underlined concepts in student responses:
The surface chemistry of picocyanobacteria is an ecologically significant area of research since these organisms play a role in biogeochemistry of lakes by precipitating calcite, potentially through Ca2+ binding to the cell surface followed by hydroxide diffusion through the membrane.
Q4. Research and summarize the major difference between Gram negative and Gram positive bacteria. How might this difference affect the surface properties of these two types of cells?
As student should readily be able to find online or in a biology text, Gram positive bacteria have a simple peptidoglycan cell wall, while Gram negative bacteria have a bilayer membrane around their cell wall.
According to the article, published results show no clear trend in the relative density of reactive sites between Gram positive and Gram negative bacteria; however, one can reasonably hypothesize that a peptidoglycan layer, which is composed of amino acid chains and sugars, would potentially have different acid-base chemistry than a lipid bilayer.
Q5. Re-read the final paragraphs of the introduction. What specific question/problem is being addressed in this article?
The authors want to characterize the surface chemistry of Gram negative picocyanobacteria with respect to “the identity, abundance, and acid-base properties of binding sites” on two strains of Synechoccocus (p. 488).
Q6. In Section 2.5, the authors state that the titration data will be plotted with –log[H+] on the x-axis and CA-CB-[H+]+Kw/[H+] on the y-axis. Assuming that γ =1 (i.e., that activity is equal to concentration), fill in the blanks below.
Assuming that concentration is roughly equal to activity (γ≈1)
- –log[H+] = pH
- Kw/[H+] = [OH-]
Q7. In their modeling of the data, what assumption do the authors make about surface charge on the bacteria?
The authors assume that the surface charges are homogeneously distributed across the bacterial surface. While this simplifies the modeling, it may not be entirely justified based on prior published research about bacterial surface chemistry.
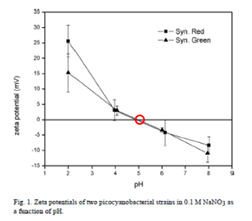
Q8. On Figure 1, circle the isoelectric point of the bacteria. How do you know that this is the isoelectric point?
[This question prepares students to discuss in-class question 3.)
The isoelectric point is the pH at which a molecule (or surface in this case) has a net charge of zero. Because the zeta potential arises from a net charge at a surface, the zeta potential will also be zero at the isoelectric point.
Q9. Based on their modeling results, the authors identify three separate pKa values associated with the picocyanobacteria surface. Fill in the table below to match the range of fitted pKa values with the most likely corresponding functional group.
|
Approximate Fitted pKa Value |
Corresponding Functional Group |
|---|---|
|
~5 |
carboxyl |
|
~6.5 |
phosphate |
|
~8.8 |
amine |
Q10. The inflection points at the three pKa values are very weak, making them impossible to identify accurately without modeling. What explanation do the authors give for the weakness of these inflection points?
The bacterial surface includes several functional groups with similar pKa values (Section 3.2, p. 490). If the students have looked at titration curves for diprotic weak acids, this is a helpful analogy since as the pKa values of the two acidic groups get closer together the two distinct inflection points are harder to distinguish.
Q11. Note that generally the conclusion section of an article should not just summarize the paper. Instead, the conclusion might address (1) questions that remain to be answered about the data, (2) potential future experiments, (3) limitations of the work, and/or (4) the broader significance of the results. Give an example of one of these from the conclusion of this paper.
Although the section is labeled “Summary,” the authors do extend their comments beyond a mere summary of their results. For example, they address the broader significance of the results to calcite formation by discussing how the functional groups identified could interact with calcium and carbonate ions. They also describe an additional potential application in remediation of metal pollution that would require further study of bacterial surface chemistry as well as studies to identify conditions for culturing picocyanobacteria in the lab.
In-Class Questions
Q1. Prior to the titrations, the authors washed the cells in a solution of 1 mM EDTA and then resuspended them in NaNO3. Both the NaNO3 and the NaOH used in the titration experiments were degassed with N2 before use. What was the purpose of each of these steps, and why were they necessary?
The composition of the cell culture medium is described in Section 2.1 (p.488) as containing numerous divalent metal ions, including Ca2+, Mg2+, Fe2+, Mn2+, Zn2+, Co2+, and Cu2+. These divalent metal ions disproportionately influence ionic strength and can interact with negatively charged groups on the cell surface, influencing measurements of zeta potential. While students may or may not realize that, classes which have covered complexometric titrations should recognize that the EDTA will chelate these metal ions (with varying affinity). The EDTA wash removes most of these ions, minimizing their effect on measurements of bacterial surface charge. The cell culture media is also buffered by dibasic potassium phosphate and boric acid. To titrate functional groups on the cell surface, it is necessary to eliminate the these weakly basic and weakly acidic components of the culture medium. Re-suspending the cells in sodium nitrate, which is a neutral salt, eliminates buffering from the solution so that acid-base behavior is coming only from the cells. Finally, the solutions were degassed with N2 to displace dissolved CO2, which forms carbonic acid in water and affects pH.
Q2. When interpreting Figures 2-4, it will be helpful to consider how these plots differ from typical plots of titrations.
- Most potentiometric titration plots have pH on the y-axis. In these plots, pH is on the x-axis.
- Most titration plots give mL of titrant on the x-axis. In this case, pH is on the x-axis and an expression representing “charge excess” (CA-CB-[H+]+Kw/[H+]) is on the y-axis.
- As the researchers add NaOH to the bacterial cell suspension to increase pH (on the x-axis), the change in pH does not directly correlate with the moles of base added. This occurs because as the NaOH is added, additional H+ is released into the solution as functional groups on the bacteria are deprotonated.
- Because the functional groups found in biological molecules, such as amines, carboxylic acids, hydroxyl groups, and phosphate groups act as weak acids or bases, biological molecules, including those at the surface of the cells act as buffering agents and influence the pH of their environment.
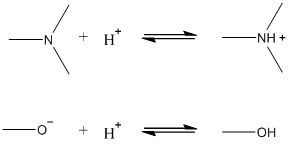
Q3. For the third pKa value (pK3 in the manuscript), the authors state that either amine or hydroxyl functionality could give rise to the observed pKa value, but they conclude based on the zeta potential measurements that this pKa corresponds to amine groups on the cell surface. Sketch the protonation reactions for a generic amine and a generic hydroxyl group in aqueous solution. Use your sketches to explain the authors’ reasoning.
In the manuscript, pK3 has a value of ~8.8, which could correspond to a hydroxyl or to an amine. If the functional group giving rise to pK3 were an amine, then below pH 5 the functional group would be protonated (because pH < pKa) and positively charged. If this functional group were a hydroxyl, then the protonated form predominant below pH 5 would be neutral. We know that the other two functional groups present, carboxylic acid and phosphate groups, have pKa values of ~5 and ~6.5, respectively. Both of these groups will be negatively charged above pH 5 and neutral below pH 5. If pK3 corresponded to the hydroxyl, all functional groups would be neutral below pH 5, resulting in a zeta potential of zero. However, the data indicate that below pH 5 the zeta potential is positive, corresponding to the presence of amines.
Q4. A related article (Aquat. Sci., 2004, 66, 19-26) critiques studies like this one, in which a cell suspension is titrated. In the related article, Claessens et al. argue that because cells are dynamic, living systems, they respond differently to titrant than a chemical solution of weak acid or weak base would respond. For example, in addition to the chemical process of protonation or deprotonation, cells may also respond with metabolic activity or biochemical reactions, including pumping of protons across the cell membrane, unfolding of cell wall proteins, cell lysis, etc. As a result, Claessens et al. suggest that titration data does not necessarily just reflect the acid-base surface chemistry of bacterial assemblies. If you were a program officer at a funding agency, would you provide financial support for further studies like the one you read? Consider the authors’ purpose, as you described it in out-of-class questions 3 and 5, and justify your answer.
The authors’ goal was to evaluate the surface chemistry of the bacteria to see how it might be involved in calcite precipitation. If the available proton donors are changing during the measurement because of biological effects of the titration then this is a problem for this application. Interestingly, the authors acknowledge that they could not measure the acid-base behavior of the cell surface as a function of ionic strength because the cells may lyse (Section 3.2, p. 491), but they do not consider the possibility of physiological responses of the cells to pH values tested during the titration. Students who have taken a cell biology course may make suggestions to fix the cells (which stops metabolic activity but also causes many of the acidic and basic groups on the cell surface to react during fixation) or to isolate just the membrane components by centrifugation for titration (which could be done, but assumes that the inner and outer membrane leaflets are the same and that all embedded proteins and other biomolecules remain intact, which may not be the case). If students immediately suggest that they would not fund these studies, consider asking if they can suggest other methods to obtain the necessary data. Classes that discuss the FT-IR data may also note that these data were obtained in the absence of any titration, allowing the authors to make some functional group assignments without dramatically perturbing the cells (although there were still suspended in NaNO3). This is a challenging problem, in that the titration of live cells is not an ideal method, but no perfect alternative currently exists, so some useful information may still be obtained by this technique.