
7.5: Voltammetric Methods
- Page ID
- 83731

Voltammetry refers to electrochemical methods in which a specific voltage profile is applied to a working electrode as a function of time and the current produced by the system is measured. This is commonly done with an instrument called a potentiostat, which for these measurements is capable of applying variable potentials to the working electrode relative to a reference electrode (like Ag/AgCl) while measuring the current that flows as a result of the electrode reaction. Depending on the particular method, it is possible to apply reducing and/or oxidizing potentials. When a reduction occurs, the current is called a cathodic current. When an oxidation occurs, the current is called an anodic current. Different voltammetric methods involve different voltage profiles. Voltammetric methods are among some of the most common electrochemical methods in use today. There are a variety of voltammetric methods. This unit will only explore three of these methods: anodic stripping voltammetry (ASV), linear sweep voltammetry, and cyclic voltammetry (CV).
Voltammetric methods typically involve the use of microelectrodes that frequently have areas on the order of 0.3-10 cm2. Originally it was common to use mercury electrodes often as a hanging mercury drop (HMDE) or as drops through a glass capillary (DME) for voltammetric methods. Mercury had several desirable properties in electrode applications. One advantage of mercury is that it has a high overvoltage toward the reduction of H+ so it can be used at high reducing potentials in water without leading to the electrochemical splitting of water into hydrogen and oxygen gas. A second advantage of mercury electrodes is that metals dissolve in mercury by forming amalgams, which improves the measurement of low concentrations of analytes. A concern with electrodes is that mercury can become fouled or the surface of a solid electrode can become poisoned, which significantly alters their properties. This can occur if species in the matrix adsorb to the surface of the electrode. Solid electrodes usually are put through a prescribed polishing procedure before used for measurement purposes, while mercury drops can easily be replaced through a glass capillary.
The use of mercury electrodes has fallen into disfavor today because of the toxicity of the metal and the difficulty of controlling spills of the material when used in electrode applications. Other possible electrodes for use in voltammetric methods include carbon paste, glassy carbon, platinum and gold. In addition, with a glassy carbon electrode it is possible to create a thin film of mercury on the electrode by reducing Hg2+. This provides the advantages of mercury electrodes described earlier without the necessity for using large quantities of mercury.
Today, ultramicroelectrodes have been fabricated with dimensions on the um scale or smaller. These are so small they can be inserted into single cells and used in certain voltammetric methods to probe chemical processes taking place inside the cell.
An important consideration in voltammetric methods is the process by which species in solution move up to the surface of the electrode, where if electroactive, they can be oxidized or reduced. There are three general processes by which ions move in solution: diffusion, convection and electrostatic migration. Diffusion involves the random motion of species in solution. Convection is physical movement created by something like a magnetic stir bar. Electrostatic migration results from the attraction of a positive species towards a negatively charged electrode or alternatively the attraction of a negative species toward a positively charged electrode. Diffusion will always occur in a solution. In some methods, it may or may not be desirable to have convective movement or electrostatic migration.
How can electrostatic migration be eliminated in an electrochemical cell?
Solution
The key to answering this question is to realize that ions in solution must somehow be shielded from the charge on the electrode. The addition of a large concentration of an inert electrolyte such as potassium chloride will accomplish this goal. For example, for a negatively charged cathode, K+ ions will be adjacent to the electrode and throughout the solution. Analyte cations that are in the solution and away from the surface of the electrode will be shielded from the charge on the electrode by all the K+ ions in between.
Samples subjected to voltammetric methods are usually purged with nitrogen or other inert gas before the analysis and maintained under an inert atmosphere during the analysis. Why is this done?
Solution
Most aqueous solutions have reasonable levels of dissolved oxygen gas (O2). Oxygen gas has a relatively low reduction potential and if not removed from the solution will generate a current that will interfere with the measurement. An inert gas used to purge the solution will displace the dissolved oxygen. Maintaining the solution under an inert atmosphere will prevent oxygen from the air from dissolving back into the solution.
7.5.1. Anodic Stripping Voltammetry (ASV)
In ASV, a potential sufficient to reduce the metal of interest is applied to the working electrode for 1-30 minutes in the solution being analyzed to plate out or deposit the metals onto the surface of the working electrode. The lower time is used for samples with metal concentrations of 10-7 M or more. The longer time is used with samples with concentrations as low as 10-11 to 10-12 M. After the deposition step, the voltage is scanned towards more positive potentials. The voltage profile for ASV as a function of time is shown in Figure 19. The solution is stirred during the deposition period in ASV to bring the species in solution up to the surface of the electrode to be reduced, but not stirred during the stripping step.
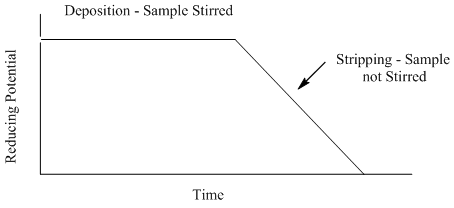
Figure 19. Potential versus time profile used in anodic stripping voltammetry.
Suppose you are analyzing a solution that contains Cd2+ and Pb2+ using ASV. You apply a potential of –1.0 V for several minutes to plate out both metals. You then scan to more positive potentials in the stripping step. Draw a generalized plot of the current you would observe as a function of time during the deposition step and during the stripping step.
The first thing to consider is the relevant half reactions for the metals being deposited out of solution.
\[\ce{Cd^{2+}(aq) + 2e^{–} <=> Cd(s)} \mathrm{\hspace{40px} E^o = - 0.403\: V}\]
\[\ce{Pb^{2+}(aq) + 2e^{–} <=> Pb(s)} \mathrm{\hspace{40px} E^o = - 0.126\: V}\]
Note that cadmium, by virtue of its more negative Eo value, is more difficult to reduce and plate out or deposit than lead. However, during the deposition period, the reducing potential should be set negative enough to deposit both metals onto the electrode. In considering what the plot of current versus time would look like during the deposition period, it might first be tempting to consider a situation similar to what we observed in coulometry (Figure 13). In the coulometric experiment, the current starts high and diminishes as the metal ions are deposited from solution. However, coulometry involves the use of large electrodes and a complete deposition or reaction of the species being analyzed. ASV involves microelectrodes so only a small fraction of the total metal ions in solution will be deposited onto the electrode. Provided the solution is stirred, the result is that a constant current occurs during the deposition step of ASV.
At the initial stage of the potential sweep towards more oxidizing values, the potential is still negative enough to deposit both metals. At some point the voltage will approach the Eo value of – 0.403 Volts and which point deposition of the cadmium ends and the cadmium that has been reduced and deposited onto the electrode will be oxidized. In the deposition step, electrons flowed from the electrode to the metal ions in the solution. In the oxidation of cadmium, the electrons flow in the opposite direction. Whereas in the deposition step, metal ions needed to be brought to the electrode to be reduced, in the oxidation step all of the metal is already deposited onto the electrode. This means that all of the deposited cadmium oxidizes almost instantaneously (and is said to be stripped from the electrode). The result is to produce a large peak of current in the oxidation step as seen in Figure 20. As the reducing potential continues to ramp down, it eventually approaches – 0.126 Volts and the lead that has been deposited onto the electrode will oxidize and be stripped from the electrode. This produces a second peak of current as seen in Figure 20.
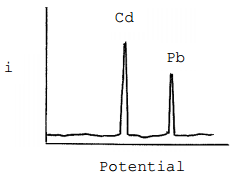
Figure 20. Plot of current versus potential for the stripping portion of an anodic stripping voltammogram of a mixture containing cadmium and lead.
What feature of the plot can be related to the concentration of the metal?
The area or height of each peak can be related to concentration using a set of standards.
What advantage(s) does anodic stripping voltammetry offer over coulometry or electroplating?
The most significant advantage of ASV over methods such as coulometry or electroplating is its unprecedented sensitivity. Looking at the plot of current versus time in Figure 20, it is important to recognize that the total area under the two peaks resulting from the two oxidation steps must be equal to the total area under the curve that resulted during the reduction step (since all the electrons that went into reducing Pb2+ and Cd2+ must be released back during the oxidation step). This means that the current peaks for the two metals will be quite intense, meaning that the method can be used to detect low concentrations of metal ions. The sensitivity can be further increased by using larger electrodes and longer deposition times, effectively concentrating more metal atoms onto the electrode. ASV can be used to measure metal concentrations as low as 10-12 M, which is an exceptionally low level (superior to flame atomic absorption spectroscopy and comparable to graphite furnace atomic absorption spectroscopy). ASV can therefore be used for ultratrace level analysis of certain metal ions.
A second advantage of ASV over coulometry or electroplating is that more than one metal species can be analyzed in a sample. The reducing step used in coulometry, electroplating or ASV does not distinguish between different species unless you are able to select the right potential to only reduce a single species. However, the oxidation step in ASV produces a separate peak for each metal plated onto the electrode.
An advantage that coulometry has over ASV is that it can be used in either a reducing or oxidizing mode and can be used with half reactions where both the reactants and products are soluble species. ASV requires a product that plates onto the electrode so is not as versatile as coulometry.
7.5.2. Linear Sweep Voltammetry
The voltage profile in linear sweep voltammetry involves a linear scan of either a reducing or oxidizing voltage (Figure 21). We will illustrate the features of this method by examining the current that is measured when a reducing potential is applied to a two component mixture.
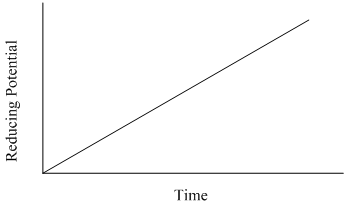
Figure 21. Potential versus time profile used in linear sweep voltammetry.
Draw the current that would be measured for a solution consisting of Cd2+ and Zn2+ in linear sweep voltammetry. Assume that the concentration of Cd2+ is about twice as large as that of Zn2+ and that the solution is stirred.
First we need to write the two relevant half reactions that will occur.
\[\mathrm{Cd^{2+}(aq) + 2e^– = Cd(s) \hspace{40px} E^o = - 0.403\: V}\]
\[\mathrm{Zn^{2+}(aq) + 2e^– = Zn(s) \hspace{40px} E^o = - 0.763\: V}\]
Comparing the Eo values indicates that cadmium is more easily reduced than zinc. As the voltage ramps to more negative values, it will reach a point where any Cd2+ species at the surface of the electrode will be reduced and a current will be observed. Because the solution is being stirred, fresh Cd2+ will be forced up to the electrode at a constant rate, thereby sustaining the current. Since this technique uses microelectrodes, as previously discussed in ASV, there will be no diminishment of current due to the depletion of Cd2+. As the reducing voltage continues to increase, eventually it will reach a value sufficient to reduce the Zn2+. Beyond this point, both Cd2+ and Zn2+ are being reduced at a constant rate and the overall current is the sum of both reductions. The plot of current versus time for the linear sweep voltammogram of this solution is shown in Figure 22.
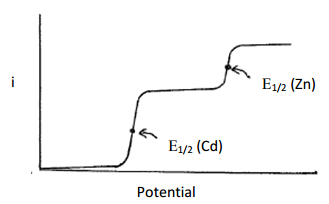
Figure 22. Plot of current versus potential for a linear sweep voltammogram of a mixture containing cadmium and zinc. The solution is stirred.
Something to note in the plot in Figure 22 is that baseline rises slightly as potential is increased before the reduction of Cd2+ begins. One reason for the rising baseline is something known as the capacitive current. Capacitive current occurs because cations in solution form a layer adjacent to the negatively charged electrode as shown in Figure 23. The separated layers of charge act as an electronic device known as a capacitor. The more negative the electrode potential becomes, the more positive charge that can be stored at its surface. Another reason a slight rise in the baseline may occur is if there are trace amounts of impurities in solution that undergo an electrochemical reaction.
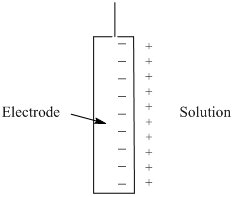
Figure 23. Alignment of cations in solution adjacent to the surface of a negatively charged electrode. The two separated layers of charge form something analogous to a capacitor.
What feature of the plot can be related to concentration?
The magnitude of the current generated for each of the reduction steps, which is seen as the height of the plateau, can be related to the concentration. Because the concentration of Cd2+ and Zn2+ in the solution was about twice that of zinc and because both are two electron reductions, the height of the plateau for cadmium in Figure 22 is higher than that of zinc. However, the relationship between the height of the plateau and the concentration for each particular species would need to be calibrated against a series of standards with known concentrations of each metal.
What feature of the plot can be used for species identification?
What is important here is that the different species are reduced at different applied potentials. The value used for species identification is known as E1/2, which is the potential at the half-way point up the reduction step. The E1/2 values for the reduction of cadmium and zinc are shown in Figure 22 and occur at an inflection point in the plot.
For the exact same solution of Cd2+ and Zn2+, draw the current that would be observed if the solution is not stirred.
Stirring the solution insures that ions continue to reach the electrode surface to maintain the current. If the solution is not stirred, when the reduction potential for an ion such as Cd2+ is reached, any Cd2+ at the electrode surface will be reduced so a rise in current comparable to that in Figure 22 will occur. Once these species are reduced, there are two ways additional Cd2+ can make it to the electrode to be reduced. One is through the process of diffusion. The other is that the electrode does have a negative charge and there can be an electrostatic attraction of Cd2+ for the electrode.
We already mentioned earlier that electrostatic attraction of species for the electrode can be eliminated by adding a high concentration of a background electrolyte to the solution (e.g., potassium chloride, K++ and Cl–). It is often desirable to run these processes in a manner that is under diffusion control. In such a case, diffusion will not cause enough Cd2+ to strike the electrode to maintain a constant current. Therefore the current will begin to drop after the initial reduction step. It will not drop to zero because diffusion of Cd2+ does occur and some current is maintained. The plot in Figure 24 shows an example of the plot that would result for a solution of Cd2+ and Zn2+ if it were run without stirring the sample.
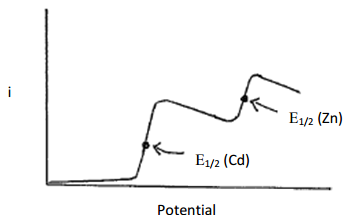
Figure 24. Plot of current versus potential for a linear sweep voltammogram of a mixture containing cadmium and zinc. The solution is not stirred.
7.5.3. Differential Pulse Linear Sweep Voltammetry
In differential pulse linear sweep voltammetry, a voltage profile similar to a linear sweep experiment is applied but then a small, increased voltage pulse is superimposed over the voltage ramp (Figure 25). In this method the current is sampled twice: (1) just before the pulse is applied and (2) just before the pulse ends. The two measurements are subtracted [(2) – (1)] and the difference is plotted.

Figure 25. Potential versus time profile used in differential pulse linear sweep voltammetry.
Draw the resulting plot for the same sample shown in Figure 22 (a solution consisting of Cd2+ and Zn2+; the concentration of Cd2+ is about twice that of Zn2+, and the solution is stirred).
In order to understand what happens here it is useful to look at the plot in Figure 22 and then consider where the measurements are made for each (1) and (2) in Figure 22. Figure 22 is reproduced as Figure 26a and examples of measurements (1) and (2) for some different pulses are shown on the plot. By applying a short pulse, the measuring of current at point (2) is essentially jumping ahead a little bit on the linear ramp. If we look at the flat portion of the plot early in the ramp, there is no change in current going from (1) to (2) so the difference between the two points is zero. If we look later on during the reduction of Cd2+ at the electrode, since there is a large jump in the current, subtracting (1) from (2) gives a large positive value. If we consider a pulse after the inflection point in the curve (E1/2) there is still a large difference between the current at points (1) and (2) but it begins to diminish. If we examine the plateau of current between the point where Cd2+ is reduced and Zn2+ has not yet started to reduce, there is no change in current between points (1) and (2) for a particular pulse so the difference is now back to zero. The plot shown in Figure 26b shows the result that would be obtained using the voltage profile shown in Figure 25. In effect, the measurement done using this profile is taking the derivative of the curve, hence the name differential pulse linear sweep voltammetry.
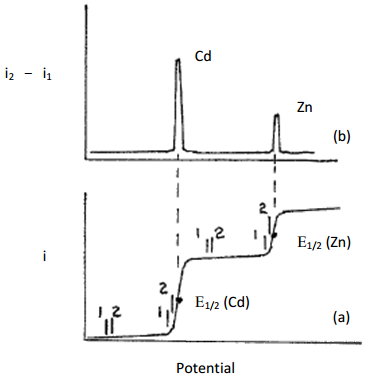
Figure 26. Plot of current versus potential for (a) a linear sweep voltammogram and (b) a differential pulse linear sweep voltammogram of a mixture containing cadmium and zinc. The points (1) and (2) indicate some examples of where current readings are taken before and after a pulse.
What advantage(s) does differential pulse linear sweep voltammetry have over conventional linear sweep voltammetry?
There are two important advantages of the differential pulse method over conventional linear sweep voltammetry. The first is that it is much more sensitive. The differential pulse method provides a sharp peak for each species being analyzed and it is much more reliable to measure either the height or area of this peak and relate it to concentration than it is to measure the height of the current in the linear sweep mode. This can be especially appreciated at low concentrations where a small peak in the differential pulse mode would be much easier to measure than only a small change in the height of the current (see Figure 27).
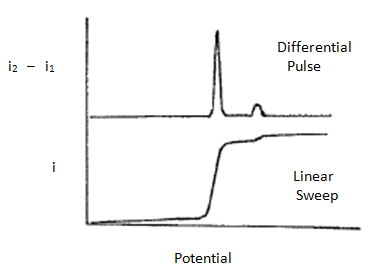
Figure 27. Plot of current versus potential for a linear sweep voltammogram and differential pulse linear sweep voltammogram for a mixture containing a high concentration of one metal and small concentration of another.
The second is that it is much easier to distinguish two species with similar E1/2 values. An example of this is shown by the linear sweep and differential pulse results in Figures 28, respectively. Whereas the linear sweep method requires a difference of about 0.2 V in the E1/2 values to distinguish two species, the differential pulse method only requires a difference of about 0.05 V.
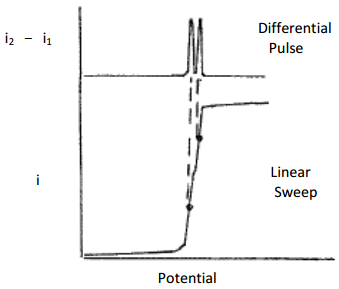
Figure 28. Plot of current versus potential for a linear sweep voltammogram and differential pulse linear sweep voltammogram for a mixture containing two metal ions with similar E1/2 values.
7.5.4. Cyclic Voltammetry
The last method we will develop is known as cyclic voltammetry (CV). In CV, scan rates can typically range from 10 mV/s to 100,000 V/s with an increase in the applied potential followed by a return back to the starting voltage as shown in Figure 29. This can be performed as an anodic or cathodic scan depending on the system being studied. For the examples herein, we will consider a cathodic scan that causes in the reduction of species in the initial solution.
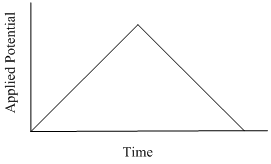
Figure 29. Applied potential vs. time profile used in cyclic voltammetry.
Draw a plot of current (y-axis) versus voltage (x-axis) that you would measure for a solution in which the Fe3+ in ferricyanide (Fe(CN)63–) is reduced to Fe2+ during the reducing phase of the CV voltage profile shown in Figure 29. The half reaction is chemically and electrochemically reversible and the solution is not stirred.
Prior voltammetric methods have given us the ability to understand the plot that will result for CV. The first half of the voltage profile (i.e., the forward sweep of potential) is essentially a linear sweep voltammogram. The second half is similar to the profile used in the latter stripping portion of ASV, although as we will see, the output usually looks quite different than the output in ASV because nothing has plated out of solution. Note, in the example given in the problem, the two species involved in the reaction (Fe2+, Fe3+) are water soluble and neither deposits out onto the electrode.
During the forward sweep, Fe3+ will be reduced to Fe2+ and a current (the forward wave) will be produced as the Fe3+ at the surface of the electrode is reduced (Location 1 in Figure 30). Beyond this point and since the solution is not stirred, the current falls because Fe3+ cannot diffuse up to the electrode fast enough to maintain a constant current (Location 2 in Figure 30). As the potential returns to the initial value it eventually reaches the potential where Fe2+ that remains next to the electrode can be oxidized back to Fe3+. This process results in an anodic current that appears as the reverse wave (Location 3 in Figure 30). For an electrode reaction that is electrochemically reversible (i.e., fast electron transfer meaning no overpotential), the peak of the forward wave will align with the E1/2 value of the reverse wave and the peak of the reverse wave will align with the E1/2 value of the forward wave as seen in Figure 30. The formal potential for a redox couple (E’o) can be calculated by taking the average of the peak potentials of the forward and reverse wave. Provided none of the Fe2+ formed in the reduction step has been lost in a subsequent chemical reaction (Figure 31), under diffusion controlled conditions where the equilibrium concentrations determined by the Nernst equation are maintained, the reverse wave should have the same peak current as the forward wave.
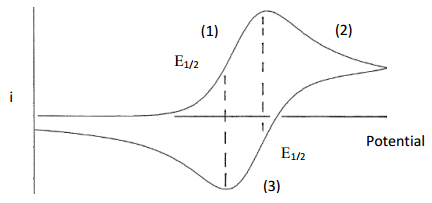
Figure 30. Plot of current versus potential for a cyclic voltammogram of a redox couple with an uncomplicated electron transfer and a diffusion-controlled chemically reversible redox reaction.
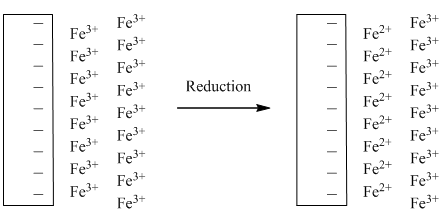
Figure 31. Representation of the solution near the electrode before and after the reduction step in a cyclic voltammogram.
The output from a method such as CV does depend significantly on a number of factors and the magnitude of the peak current is described more fully using what is known as the Randles-Sevcik equation. Factors such as the number of electrons transferred in the redox reaction, the electrode area, the diffusion coefficient for the species being analyzed, the concentration of the species being analyzed and the potential scan rate all influence the peak current. The reader is referred to the following resource for a discussion of the Rangles-Sevcik equation:
The value of CV is not so much for quantitative analysis but for the analysis of mechanistic properties of electrochemical reactions. Sometimes it is advantageous to do more than one scan when using CV to examine reaction mechanisms. If we consider the chemically and electrochemically reversible electrode reaction discussed above, a second and third voltage scan would produce plots identical to that shown in Figure 30. However, if the product of the initial electrochemical reaction underwent a further reaction, it may produce an electrochemically inactive product that is not observed in the CV, or an active one that is observed in subsequent scans. Let’s consider some other examples of outcomes of CV.
Draw a plot that could be obtained for an electrochemical reaction that is chemically irreversible and forms an electrochemically inactive product.
In this case, there would be no reverse wave. Assuming the process involved applying a reduction potential, the product of the reduction would not be able to be oxidized as the voltage came back down the ramp. The current vs. potential plot obtained in this situation is shown in Figure 32.
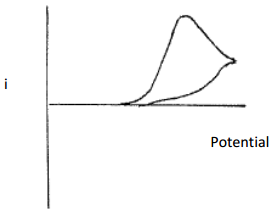
Figure 32. Plot of current versus potential for a cyclic voltammogram of a chemically irreversible redox couple in which the product that is formed is electrochemically inactive.
Draw the plot of current vs. potential that would be obtained for a reversible chemical reaction in which only the reverse reaction has an overpotential, but the potential eventually is sufficient to complete the reverse reaction.
In this case, there would be a reverse wave but because of the overvoltage it would be offset from the forward wave as shown in Figure 33. Another difference is that the slower electron transfer occurring in the case of an electrochemically irreversible reaction would lead to a flatter profile on the reverse wave.
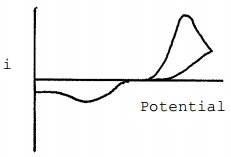
Figure 33. Plot of current versus potential for a cyclic voltammogram of a redox couple that is chemically reversible but electrochemically irreversible because of an overpotential on the reverse reaction.
Propose a reaction mechanism that would explain the following cyclic voltammogram. The first voltage cycle is shown as a solid line. The second voltage cycle is shown as a dotted line. A third voltage cycle gives the same output as the dotted line. Assume that a reducing potential is applied.
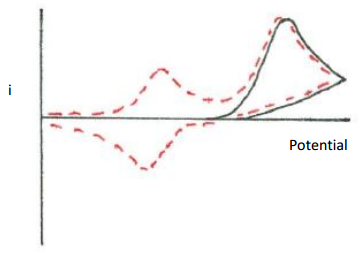
Figure 34. Plot of current versus potential for a cyclic voltammogram. Solid line is the first scan. Dotted line is the second scan.
The first cycle indicates that a species was reduced. However, the reaction is chemically irreversible as there is no reverse wave. The second cycle shows a new species showing up in the cyclic voltammogram. Presumably the product formed from the reduction either decomposed or further reacted to produce some new species. This new species is electrochemically active so a new forward wave shows up in the second cycle. The electrochemical reaction of the new species is reversible so a reverse wave for it also occurs in the second cycle. The new species likely has a smaller wave than the original species in solution because in this case some of the product, which was produced through a chemical reaction, will diffuse away from the electrode.