
14.2: Rates of Chemical Reactions
- Page ID
- 60725

Introduction
The rate of reaction, often called the "reaction velocity" and is a measure of how fast a reaction occurs. As a reaction proceeds in the forward direction products are produced as reactants are consumed, and the rate is how fast this occurs. Sort of like the speed of a car is how its location changes with respect to time, the rate is how the concentration changes over time. This makes sense, because products are produced as the reaction proceeds and they thus get more concentrated, while reactants are consumed and thus become less concentrated. As the balanced equation describes moles of species it is common to use the unit of Molarity (M=mol/l) for concentration and the convention is to use square brackets [ ] to describe concentration of a species. So the concentration of chemical "A" is denoted as:
\[ \left [ \textbf{A} \right ] \\ \text{with units of }\frac{mols}{l} \text{ for the chemical species "A"} \]
The reaction rate of Chemical "A" is
\[R_A= \frac{\Delta \left [ \textbf{A} \right ]}{\Delta t} \]
typically in units of \(\frac{M}{sec}\) or \(\frac{mol}{l \cdot sec}\) (they mean the same thing), and of course any unit of time can be used, depending on how fast the reaction occurs, so an explosion may be on the nanosecond time scale while a very slow nuclear decay may be on a gigayear scale. It should also be mentioned that in the gas phase we often use partial pressure (PA), but for now will stick to M/time.
By convention we say reactants are on the left side of the chemical equation and products on the right
\[\text{Reactants} \rightarrow \text{Products}\]
Reactants are consumed, and so their concentrations go down (is negative), while products are produced, and so their concentrations go up. It is important to keep this notation, and maintain the convention that a \(\Delta\) means the final state minus the initial state.
- The Rate of Disappearance of Reactants \[-\dfrac{\Delta[Reactants]}{\Delta{t}}\] Note this is actually positive because it measures the rate of disappearance of the reactants, which is a negative number and the negative of a negative is positive.
- The Rate of Formation of Products \[\dfrac{\Delta{[Products]}}{\Delta{t}}\] This is the rate at which the products are formed.
Note: It is important to maintain the above convention of using a negative sign in front of the rate of reactants. Later we will see that reactions can proceed in either direction, with "reactants" being formed by "products" (the "back reaction"). When this happens, the actual value of the rate of change of the reactants \(\dfrac{\Delta[Reactants]}{\Delta{t}}\) will be negative, and so eq. 14.1.3 will be positive, as it is taking the negative of a negative. We do not need to worry about that now, but we need to maintain the conventions.
Exercise \(\PageIndex{1}\)
Write the rate of reaction for each species in the following generic equation, where capital letters denote chemical species
\[A + B \rightarrow C + D\]
- Answer
-
- rate of disappearance of A \[\text{rate}=-\dfrac{\Delta[A]}{\Delta{t}} \nonumber \]
- rate of disappearance of B \[\text{rate}=-\dfrac{\Delta[B]}{\Delta{t}} \nonumber\]
- rate of formation of C \[\text{rate}=\dfrac{\Delta[C]}{\Delta{t}}\nonumber\]
- rate of formation of D) \[\text{rate}=\dfrac{\Delta[D]}{\Delta{t}}\nonumber\]
Note
If a chemical species is in the gas phase and at constant temperature it's concentration can be expressed in terms of its partial pressure. Consider gas "A",
\[P_AV=n_ART \\ \; \\ [A] = \frac{n_A}{V} =\frac{P_A}{RT}\]
So for systems at constant temperature the concentration can be expressed in terms of partial pressure.
Reaction Graphs
It is common to plot the concentration of reactants and products as a function of time. Figure \(\PageIndex{1}\) shows a simple plot for the reaction
\[A \rightarrow B\]
Note that this reaction goes to completion, and at t=0 the initial concentration of the reactant (purple [A]) was 0.5M and if we follow the reactant curve (purple) it decreases to a bit over 0.1M at twenty seconds and by 60 seconds the reaction is over and all of the reactant had been consumed. On the other hand we could follow the product concentration on the product curve (green) that started at zero, reached a little less than 0.4M after 20 seconds and by 60 seconds the final concentration of 0.5 M was attained.the there was no [B], but after were originally 50 purple particles in the container, which were completely consumed after 60 seconds. You note from eq. 14.1.7 that for stoichiometric coefficients of A and B are the same (one) and so for every A consumed a B was formed and these curves are effectively symmetric. If the reaction had been \(A\rightarrow 2B\) then the green curve would have risen at twice the rate of the purple curve and the final concentration of the green curve would have been 1.0M
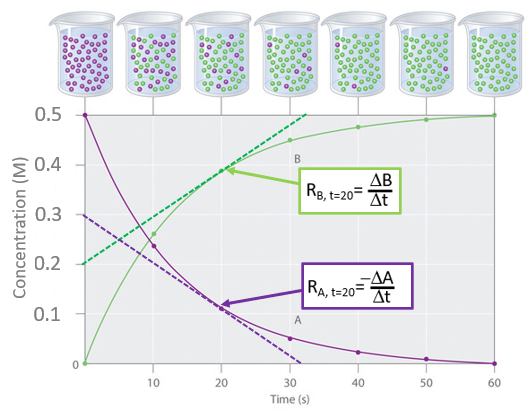 Figure \(\PageIndex{1}\):Reaction plot of the number of molecules over time
The rate is technically the instantaneous change in concentration over the change in time when the change in time approaches is technically known as the derivative.
\[\frac{d[A]}{dt}=\lim_{\Delta t\rightarrow 0}\frac{\Delta [A]}{\Delta t}\]
Calculus is not a prerequisite for this class and we can obtain the rate from the graph by drawing a straight line that only touches the curve at one point, the tangent to the curve, as shown by the dashed curves in figure \(\PageIndex{1}\). From this we can calculate the rate of reaction for A and B at 20 seconds
\[R_{A, t=20}= -\frac{\Delta [A]}{\Delta t} = -\frac{0.0M-0.3M}{32s-0s} \; =\; 0.009 \; Ms^{-1} \; \;or \; \; 9 \; mMs^{-1} \\ \; \\ and \\ \; \\ R_{B, t=20}= \; \frac{\Delta [B]}{\Delta t} \; = \; \; \frac{0.5M-0.2}{32s-0s} \;= \; 0.009\; Ms^{-1} \; \; or \; \; 9 \; mMs^{-1}\]
If needed, review section 1B.5.3 on graphing straight line functions and do the following exercise.
Exercise \(\PageIndex{2}\)
What is the rate of reaction for the reactant "A" in figure \(\PageIndex{1}\) at 30 seconds?.
- Answer
-
The black line in the figure below is the tangent to the curve for the decay of "A" at 30 seconds. It would have been better to use graph paper with a higher grid density that would have allowed us to exactly pick points where the line intersects with the grid lines. Instead, we will estimate the values when the line intersects the axes.
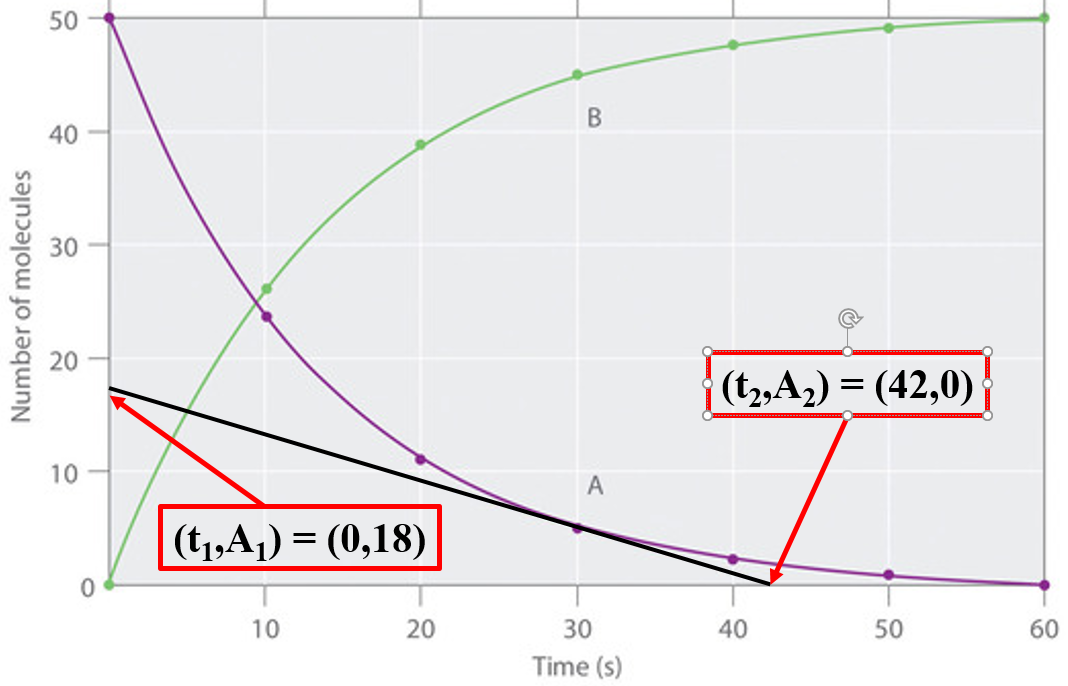
At 30 seconds the slope of the tangent is:
\[\begin{align}\dfrac{\Delta [A]}{\Delta t} &= \frac{A_{2}-A_{1}}{t_{2}-t_{1}} \nonumber \\ \nonumber \\ & = \frac{(0-18)molecules}{(42-0)sec} \nonumber \\ \nonumber \\ &= -0.43\left ( \frac{molecules}{second} \right ) \nonumber \\ \nonumber \\ R & = -\dfrac{\Delta [A]}{\Delta t} = 0.43\left ( \frac{\text{molecules consumed}}{second} \right ) \end{align} \nonumber \]
NOTE:
- The value of the rate of consumption of A is a negative number (A2 < A1)
- Since A\(\rightarrow\)B, the curve for the production of B is symmetric to the consumption of A, except that the value of the rate is positive (A1 < A2)
- The Y-axis (50 to 0 molecules) is not realistic, and a more common system would be the molarity (number of molecules expressed as moles inside of a container with a known volume).
You should also note that from figure \(\PageIndex{1}\) that the initial rate is the highest and as the reaction approaches completion the rate goes to zero because no more reactants are being consumed or products are produced, that is, the line becomes a horizontal flat line. We shall see that the rate is a function of the concentration, but it does not always decrease over time like it did in this example.
Exercise \(\PageIndex{3}\)
Calculate the rates of reactions for the product curve (B) at 10 and 40 seconds and show that the rate slows as the reaction proceeds.
- Answer
-
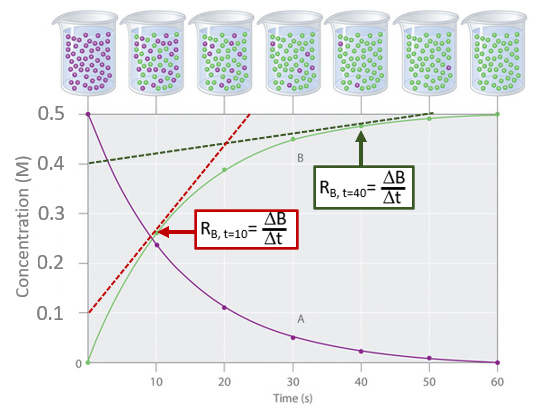 Tangents to the product curve at 10 and 40 seconds
The red curve represents the tangent at 10 seconds and the dark green curve represents it at 40 seconds.
\[ R_{B, t=10}= \; \frac{0.5-0.1}{24-0}=20mMs^{-1} \\ \; \\ R_{B, t=40}= \; \frac{0.5-0.4}{50-0}=2mMs^{-1} \nonumber\]
and so the reaction is clearly slowing down over time.
Reaction Rate of Hydrolysis of Aspirin
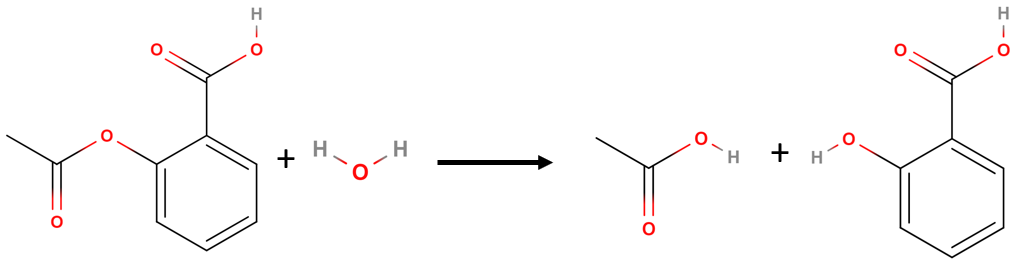
Lets look at a real reaction, the reaction rate for the hydrolysis of aspirin, probably the most commonly used drug in the world, (more than 25,000,000 kg are produced annually worldwide.) Aspirin (acetylsalicylic acid) reacts with water (such as water in body fluids) to give salicylic acid and acetic acid. Because salicylic acid is the actual substance that relieves pain and reduces fever and inflammation, a great deal of research has focused on understanding this reaction and the factors that affect its rate.
Data for the hydrolysis of a sample of aspirin are given below and are shown in the adjacent graph. This data were obtained by removing samples of the reaction mixture at the indicated times and analyzing them for the concentrations of the reactant (aspirin) and one of the products (salicylic acid).
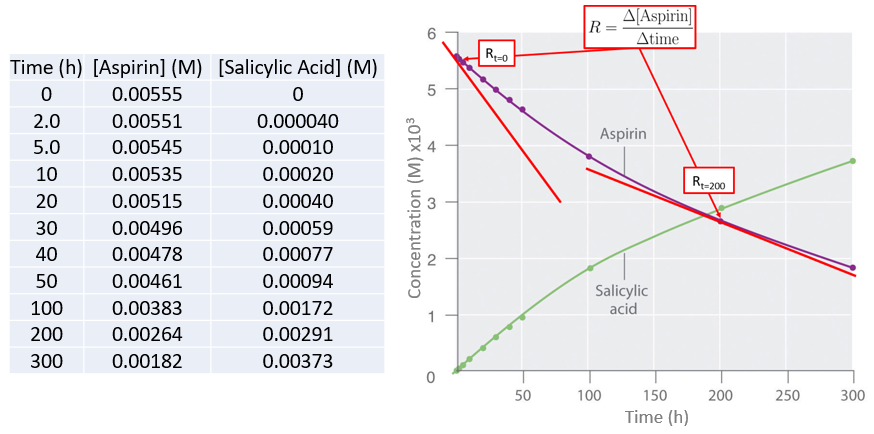 Figure \(\PageIndex{3}\): Graph of concentration vs. time for the hydrolysis of aspirin into salicylic acid showing the rate (tangent to the curve) at t=0 and t=200 hrs.
 In addition to calculating the rate from the curve we can also calculate the average rate over time from the actual data, and the shorter the time the closer the average rate is to the actual rate. Let's calculate the average rate for the production of salicylic acid between the initial measurement (t=0) and the second measurement (t=2 hr).
\( Average \:rate_{\left ( t=2.0-0.0\;h \right )}=\dfrac{\left [ salicylic\;acid \right ]_{2}-\left [ salicylic\;acid \right ]_{0}}{2.0\;h-0.0\;h} \)
\( =\dfrac{0.040\times 10^{-3}\;M-0.000\;M}{2.0\;h-0.0\;h}= 2\times 10^{-5}\;Mh^{-1}=20 \mu Mh^{-1}\)
Exercise \(\PageIndex{4}\)
What is the average rate of salicylic acid production between the last two measurements of 200 and 300 hours, and before doing the calculation, would you expect it to be greater or less than the initial rate? (You may look at the graph)
- Answer
-
It should be clear from the graph that the rate decreases.
\( rate_{\left ( t=300-200\;h \right )}=\dfrac{\left [ salicylic\;acid \right ]_{300}-\left [ salicylic\;acid \right ]_{200}}{300\;h-200\;h} \)
\( =\dfrac{3.73\times 10^{-3}\;M-2.91\times 10^{-3}\;M}{100 \;h}=8.2\times 10^{-6}\;Mh^{-1}= 8\mu Mh^{-1} \)
Relative Rates
The storichiometric coefficients of the balanced reaction relate the rates at which reactants are consumed and products are produced . If we want to relate the rate of reaction of two or more species we need to take into account the stoichiometric coefficients, consider the following reaction for the decomposition of ammonia into nitrogen and hydrogen.
\[\ce{2NH3\rightarrow N2 + 3H2 } \label{Haber}\]
It is clear from the above equation that for mass to be conserved, every time two ammonia are consumed, one nitrogen and three hydrogen are produced. This means that the rate ammonia consumption is twice that of nitrogen production, while the rate of hydrogen production is three times the rate of nitrogen production.
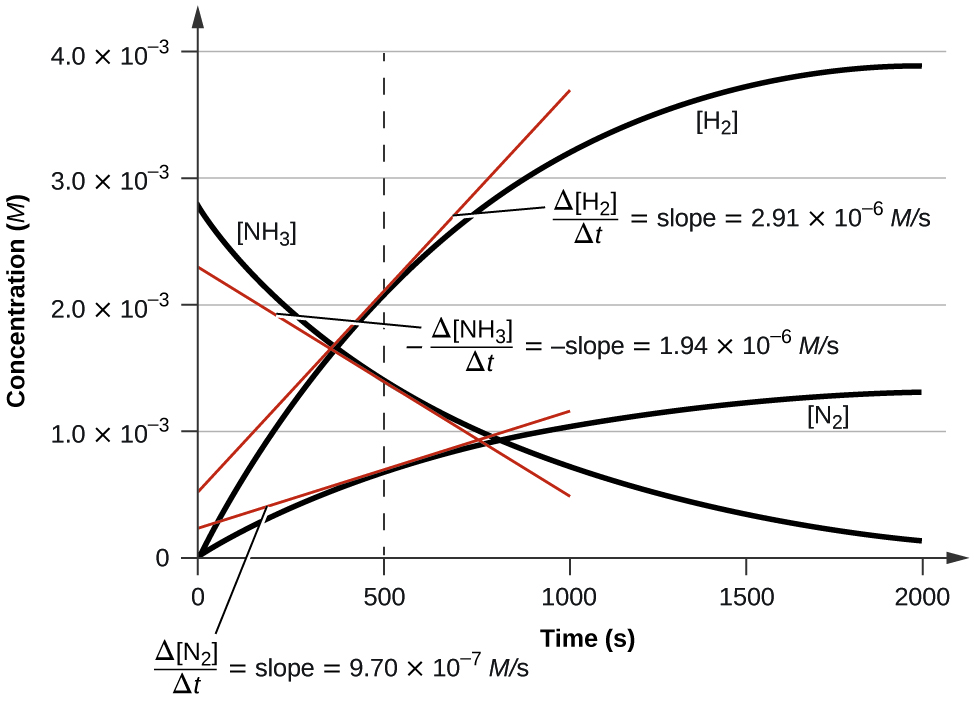
If you take the value at 500 seconds in figure 14.1.2 and divide by the stoichiometric coefficient of each species, they all equal the same value. Equation 14-1.9 is a generic equation that can be used to relate the rates of production and consumption of the various species in a chemical reaction where capital letter denote chemical species, and small letters denote their stoichiometric coefficients when the equation is balanced.
\[aA + bB \rightarrow cC + dD\]
We can normalize the above rates by dividing each species by its coefficient, which comes up with a relative rate of reaction
\[\underbrace{R_{relative}=-\dfrac{1}{a}\dfrac{\Delta [A]}{\Delta t} = - \dfrac{1}{b}\dfrac{\Delta [B]}{\Delta t} = \dfrac{1}{c}\dfrac{\Delta [C]}{\Delta t} = \dfrac{1}{d}\dfrac{\Delta [D]}{\Delta t}}_{\text{Relative Rate of Reaction}}\]
There are two important things to note here:
- There are actually 5 different Rate expressions for the above equation, The relative rate, and the rate of reaction with respect to each chemical species, A, B, C & D. If you can measure any of the species (A,B,C or D) you can use the above equality to calculate the rate of the other species.
- In relating the reaction rates, the reactants were multiplied by a negative sign, while the products were not.
Exercise \(\PageIndex{5}\)
What is the rate of ammonia production for the Haber process (Equation \ref{Haber}) if the rate of hydrogen consumption is -0.458M/min?
- Answer
-
\[\begin{align} -\dfrac{1}{3}\dfrac{\Delta [H_{2}]}{\Delta t} &= \dfrac{1}{2}\dfrac{\Delta [NH_{3}]}{\Delta t} \nonumber \\ \nonumber\\ \dfrac{\Delta [NH_{3}]}{\Delta t} &= -\dfrac{2}{3}\dfrac{\Delta [H_{2}]}{\Delta t} \nonumber\\ \nonumber \\ &= -\dfrac{2}{3}\left ( -0.458 \frac{M}{min}\right ) \nonumber \\ \nonumber \\ &=0.305 \frac{mol}{L\cdot min} \nonumber \end{align} \nonumber \]
In Class Activity
ADAPT \(\PageIndex{1}\)
Test Yourself
Homework: Section 14.2
Query \(\PageIndex{1}\)
Query \(\PageIndex{2}\)
Contributors
Robert E. Belford (University of Arkansas Little Rock; Department of Chemistry). The breadth, depth and veracity of this work is the responsibility of Robert E. Belford, rebelford@ualr.edu. You should contact him if you have any concerns. This material has both original contributions, and content built upon prior contributions of the LibreTexts Community and other resources, including but not limited to:
- Liliane Poirot
- Modifications or content borrowed from
- Paul Flowers et al. Open Stax
- Joshua Halpern, Scott Sinex, Scott Johnson