
14: Fourier Transform Infrared Spectroscopy (FTIR)
- Page ID
- 73006
CHEM 174 Physical Chemistry Laboratory II
Fourier Transform Infrared Spectroscopy (FTIR)
How a Fourier Transform Infrared Spectrometer Works
There are many advantages to a Fourier Transform Infrared Spectrometer (FTIR): higher resolution at lower cost, relatively less time to collect spectra, for reacting systems the spectra are easier to interpret and FTIR can be used in a mode (photoacoustic) where samples do not have to be optically thin.
A Fourier Transform Infrared Spectrometer (FTIR) is a based on the interferometer. The interferometer in an FTIR works on the same principles as the one used in the Michelson–Morley experiment. The Michelson–Morley showed that the speed of light is the same in all directions; a key finding supporting special relativity. Figure 1 shows a schematic of an interferometer.
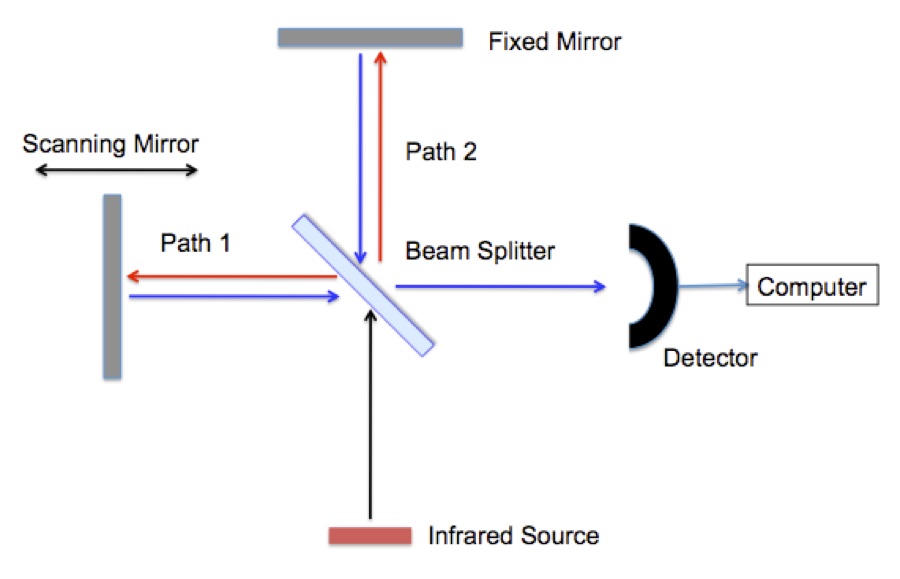
Figure 1. A schematic of an interferometer used in a Fourier Transfer Infrared Spectrometer (FTIR).
Infrared radiation is typically generated by passing electricity through a conducting ceramic bar (glow bar). First the radiation reaches a “beam splitter”. The beam splitter is a partially coated mirror that reflects half of the infrared radiation and passes the remaining half. The radiation follows either path 1 or path 2 to mirrors that return it to the beam splitter where the beams recombine and they are reflected in to an infrared detector. Remember that the radiation is a wave, Figure 2. The signal seen at the detector at any moment in time depends on the difference between path 1 and path 2.
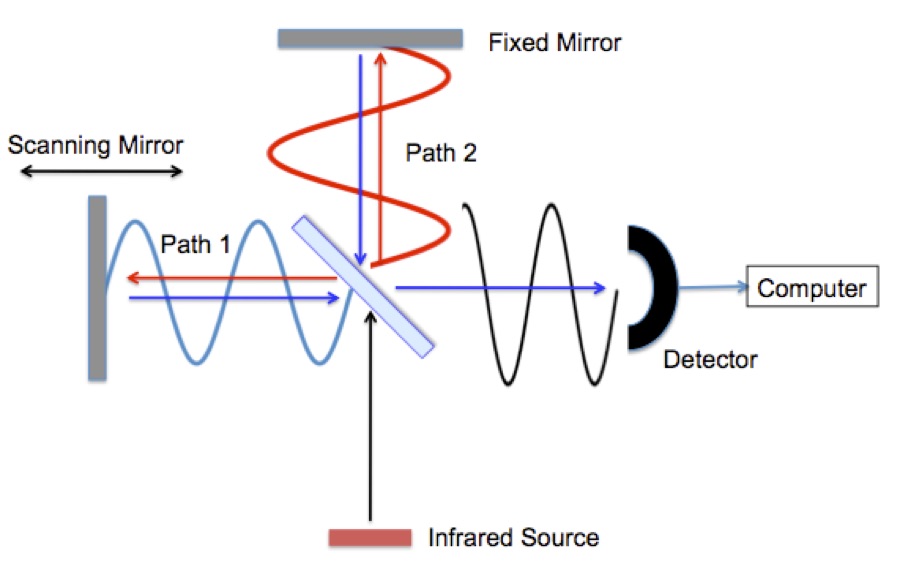
Figure 2. FTIR interferometer with radiation waves drawn in.
Suppose for a moment that we use a laser that emits a single wavelength as the radiation source. Next suppose that the lengths of path 1 and path 2 are both even multiples of the laser’s radiation wavelength. When the radiation returns to the beam splitter it arrives “in phase”, the beams reinforce each other when they recombine and a strong signal will be seen at the detector, Figure 1A. This process is called “constructive interference”.
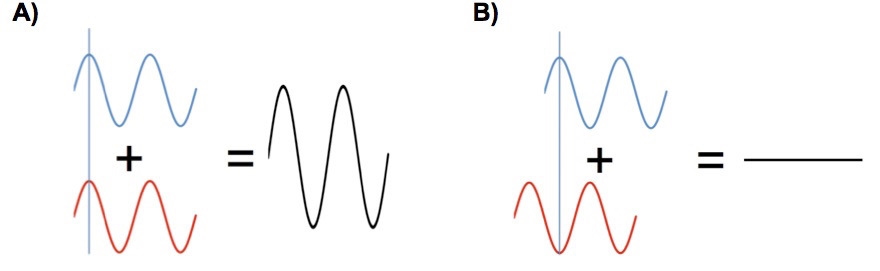
Figure 3. (A) Constructive interference by two recombining radiation beams. (B) Destructive interference by two recombining radiation beams.
Suppose that the scanning mirror on path 1 is moved a distance equal to half of the wavelength of the laser radiation. Now when the beams recombine at the beam splitter they will “out of phase” and destructively interfere cancelling each other and no signal will be seen at the detector. If the scanning mirror is scanned at a constant rate a sinusoidal signal is generated at the detector.
The frequency of the detector signal depends on the speed of the mirror and wavelength of the radiation. Let infrared radiation with a frequency of 1000 cm-1 pass through the interferometer and move the scanning mirror with a speed of 1 cm s-1. There will be 1000 waves of infrared radiation per centimeter for this frequency (this is why cm-1 is called sometimes “wave-numbers”). If the mirror is moved a total of 1 cm then there will be 1000 cycles of constructive and destructive interference. For these conditions the frequency of the detector signal will be 1000 cm-1 × 1 cm s-1 = 1000 s-1. The important point is that the scanning information has coded the wavelength of the infrared radiation so that the detector can measure frequency and intensity at the same time. An infrared detector is very capable of detecting the intensity and the frequency of an infrared signal with an audio frequency.
When multiple frequencies pass through the interferometer, the signal at the detector is the sum of the coded frequencies. A glow bar is a ceramic that emits infrared radiation when heated by an electric current. It is an excellent approximation to a blackbody radiator, Figure 4A. When this radiation passes through the interferometer the signals add, “the superposition”, of all the signals is observed at the detector, Figure 4B. Figure 4B is called an “interferogram”. Note that the information contained in a spectrum and the interferogram is identical.
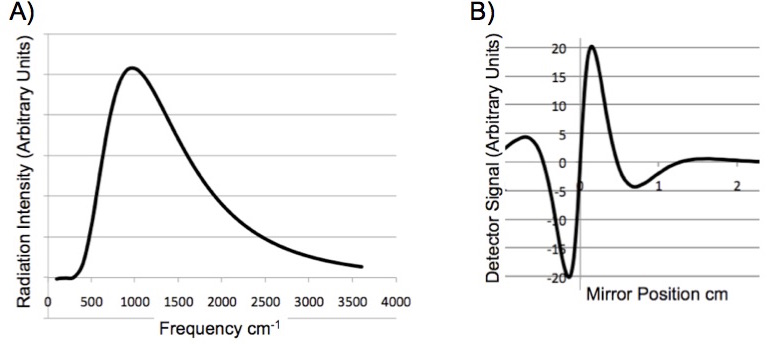
Figure 4. (A) Blackbody radiation spectrum of a glow bar. (B) The signal seen at the detector of an FTIR as a function of the scanning mirror position.
Although the information contained in a spectrum and the interferogram is identical chemists find it difficult to interpret interferogram in terms of molecular structure. The interferogram measured by the FTIR must be converted back to a spectrum. This transformation is accomplished by applying the Fourier transform to the interferogram. Equation (1) shows the Fourier transform.
\[\widetilde{f}\left ( \nu \right )=\int_{-x}^{x} f\left ( x \right )e^{-2i\pi \nu x}dx\]
where: \(f\left ( x \right ) \) is the signal measured at the detector which is a function of the mirror position, \(x\), \(\widetilde{f}\left ( \nu \right )\) is the spectrum which is a function of frequency, \(\nu \). Figure 5 shows a sample function and its Fourier transform.
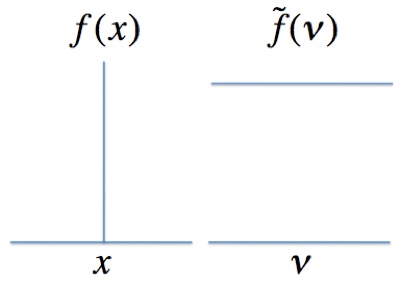
Figure 5. The Fourier transform of a delta function, \(f\left ( x \right ) \) , is a horizontal line, \(\widetilde{f}\left ( \nu \right )\). The more highly \(f\left ( x \right ) \) is defined in space the less defined is \(\widetilde{f}\left ( \nu \right )\) . The Heisenberg Uncertainty Principle is a consequence of this relationship.
To calculate a spectrum from an interferogram considerable computational resources are required and therefore Fourier transformation methods came into widespread use only after the invention of modern computers.
Procedure
This report will be combined with the next laboratory session. Please take the spectra as a group and discuss together. But please – each person will submit their own individual report.
For all of the spectra gathered save ASCII copies to disk and take with you.
- Record a spectrum of a standard polyethylene sample.
- Record a gas-phase spectrum of air using an evacuated cell as the reference.
- Record a gas-phase spectrum of acetaldehyde using an air filled cell as the reference. Expose to UV light for an hour and run a second spectrum.
- Record a liquid-phase spectrum of acetaldehyde using attenuated total reflection (ATR) with air as the reference.
- Record a spectrum of solid Congo Red using ATR with air as the reference.
Analysis
This report will be combined with the next laboratory. For all of the spectra gathered save ASCII copies to disk and take with you.
- Use the measured IR lines of the standard polyethylene sample to check the wavelength calibration.
- Identify as many of the IR bands/lines for as many atmospheric gases as you can in the air spectrum. Do you expect to see Ar, O2 and N2?
- Discuss the bands found in the IR spectra of acetaldehyde. What differences do you see between the gas and liquid-phase spectra?
- For the gas-phase acetaldehyde sample what are the differences in the spectra before and after the sample was exposed to UV radiation? If there are differences, what happened?
- Discuss the IR spectrum of Congo Red. Is there any relationship between the pi-chain and the observed IR spectrum? What are the differences in the functional groups between the particle-in-a-box-experiment dyes (Laboratory 13) and the Congo Red dye? Are these groups in Congo Red seen in its IR spectra?