
12.3: Mass Spectrometry of Some Common Functional Groups
- Page ID
- 67279
Objective
After completing this section, you should be able to predict the expected fragmentation for common functional groups, such as alcohols, amines, and carbonyl compounds.
Make certain that you can define, and use in context, the key terms below.
- alpha (α) cleavage
- McLafferty rearrangement
Much of the utility in electron-ionization MS comes from the fact that the radical cations generated in the electron-bombardment process tend to fragment in predictable ways. Detailed analysis of the typical fragmentation patterns of different functional groups is beyond the scope of this text, but it is worthwhile to see a few representative examples, even if we don’t attempt to understand the exact process by which the fragmentation occurs. We saw, for example, that the base peak in the mass spectrum of acetone is m/z = 43. This is the result of cleavage at the ‘alpha’ position - in other words, at the carbon-carbon bond adjacent to the carbonyl. Alpha cleavage results in the formation of an acylium ion (which accounts for the base peak at m/z = 43) and a methyl radical, which is neutral and therefore not detected.

After the parent peak and the base peak, the next largest peak, at a relative abundance of 23%, is at m/z = 15. This, as you might expect, is the result of formation of a methyl cation, in addition to an acyl radical (which is neutral and not detected).

A common fragmentation pattern for larger carbonyl compounds is called the McLafferty rearrangement:

The mass spectrum of 2-hexanone shows a 'McLafferty fragment' at m/z = 58, while the propene fragment is not observed because it is a neutral species (remember, only cationic fragments are observed in MS). The base peak in this spectrum is again an acylium ion.

When alcohols are subjected to electron ionization MS, the molecular ion is highly unstable and thus a parent peak is often not detected. Often the base peak is from an ‘oxonium’ ion.


Other functional groups have predictable fragmentation patterns as well. By carefully analyzing the fragmentation information that a mass spectrum provides, a knowledgeable spectrometrist can often ‘put the puzzle together’ and make some very confident predictions about the structure of the starting sample.
Click here for examples of compounds listed by functional group, which demonstrate patterns which can be seen in mass spectra of compounds ionized by electron impact ionization.
The mass spectrum of an aldehyde gives prominent peaks at m/z = 59 (12%, highest value of m/z in the spectrum), 58 (85%), and 29 (100%), as well as others. Propose a structure, and identify the three species whose m/z values were listed.
Solution
The mass spectrum fits that of propanal. The most abundant fragment (the base peak) is the acylium ion containing the aldehyde hydrogen.
Exercises
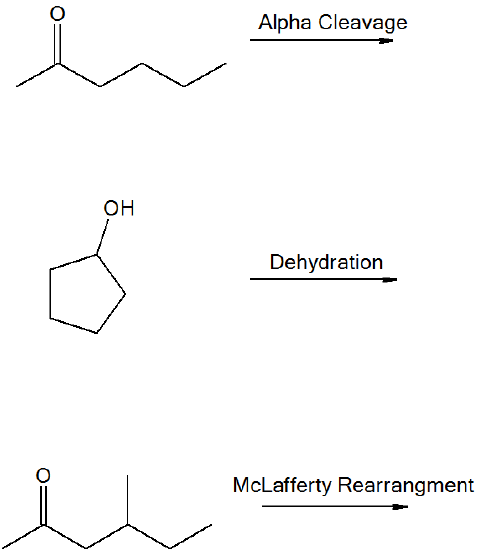
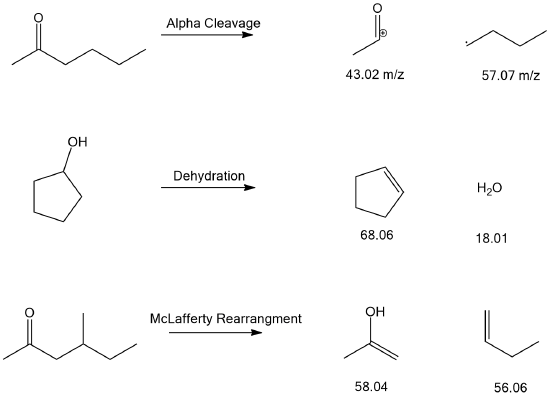
What are the masses of the following fragments in the following fragmentations?
- Answer
-
Contributors and Attributions
Dr. Dietmar Kennepohl FCIC (Professor of Chemistry, Athabasca University)
Prof. Steven Farmer (Sonoma State University)
Organic Chemistry With a Biological Emphasis by Tim Soderberg (University of Minnesota, Morris)