1.1: The Periodic Table
- Page ID
- 28095
Before you get started - What is Organic Chemistry?
The nuclear atom
The precise physical nature of atoms finally emerged from a series of elegant experiments carried out between 1895 and 1915. The most notable of these achievements was Ernest Rutherford's famous 1911 alpha-ray scattering experiment, which established that
 •
•
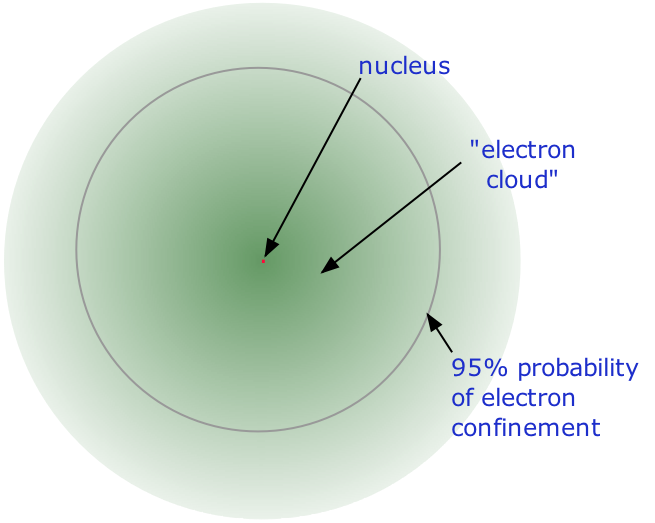
- Almost all of the mass of an atom is contained within a tiny (and therefore extremely dense)nucleus which carries a positive electric charge whose value identifies each element and is known as the atomic number of the element.
- Almost all of the volume of an atom consists of empty space in which electrons, the fundamental carriers of negative electric charge, reside. The extremely small mass of the electron (1/1840 the mass of the hydrogen nucleus) causes it to behave as a quantum particle, which means that its location at any moment cannot be specified; the best we can do is describe its behavior in terms of the probability of its manifesting itself at any point in space. It is common (but somewhat misleading) to describe the volume of space in which the electrons of an atom have a significant probability of being found as the electron cloud. The latter has no definite outer boundary, so neither does the atom. The radius of an atom must be defined arbitrarily, such as the boundary in which the electron can be found with 95% probability. Atomic radii are typically 30-300 pm.
Protons and neutrons
The nucleus is itself composed of two kinds of particles. Protons are the carriers of positive electric charge in the nucleus; the proton charge is exactly the same as the electron charge, but of opposite sign. This means that in any [electrically neutral] atom, the number of protons in the nucleus (often referred to as the nuclear charge) is balanced by the same number of electrons outside the nucleus.
Because the electrons of an atom are in contact with the outside world, it is possible for one or more electrons to be lost, or some new ones to be added. The resulting electrically-charged atom is called an ion.
The other nuclear particle is the neutron. As its name implies, this particle carries no electrical charge. Its mass is almost the same as that of the proton. Most nuclei contain roughly equal numbers of neutrons and protons, so we can say that these two particles together account for almost all the mass of the atom.
Atomic Number (Z)
What single parameter uniquely characterizes the atom of a given element? It is not the atom's relative mass, as we will see in the section on isotopes below. It is, rather, the number of protons in the nucleus, which we call the atomic number and denote by the symbol Z. Each proton carries an electric charge of +1, so the atomic number also specifies the electric charge of the nucleus. In the neutral atom, the Z protons within the nucleus are balanced by Z electrons outside it.
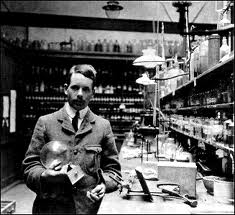
Atomic numbers were first worked out in 1913 by Henry Moseley, a young member of Rutherford's research group in Manchester.
Moseley searched for a measurable property of each element that increases linearly with atomic number. He found this in a class of X-rays emitted by an element when it is bombarded with electrons. The frequencies of these X-rays are unique to each element, and they increase uniformly in successive elements. Moseley found that the square roots of these frequencies give a straight line when plotted against Z; this enabled him to sort the elements in order of increasing atomic number.
You can think of the atomic number as a kind of serial number of an element, commencing at 1 for hydrogen and increasing by one for each successive element. The chemical name of the element and its symbol are uniquely tied to the atomic number; thus the symbol "Sr" stands for strontium, whose atoms all have Z = 38.
Mass number (A)
This is just the sum of the numbers of protons and neutrons in the nucleus. It is sometimes represented by the symbol A, so
A = Z + N
Nuclides and their Symbols
The term nuclide simply refers to any particular kind of nucleus. For example, a nucleus of atomic number 7 is a nuclide of nitrogen. Any nuclide is characterized by the pair of numbers (Z ,A). The element symbol depends on Z alone, so the symbol 26Mg is used to specify the mass-26 nuclide of manganese, whose name implies Z=12. A more explicit way of denoting a particular kind of nucleus is to add the atomic number as a subscript. Of course, this is somewhat redundant, since the symbol Mg always implies Z=12, but it is sometimes a convenience when discussing several nuclides.
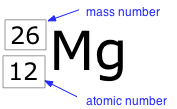
Two nuclides having the same atomic number but different mass numbers are known as isotopes. Most elements occur in nature as mixtures of isotopes, but twenty-three of them (including beryllium and fluorine, shown in the table) are monoisotopic. For example, there are three natural isotopes of magnesium: 24Mg (79% of all Mg atoms), 25Mg (10%), and 26Mg (11%); all three are present in all compounds of magnesium in about these same proportions.
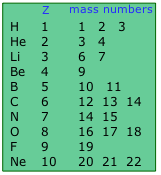
Approximately 290 isotopes occur in nature. The two heavy isotopes of hydrogen are especially important— so much so that they have names and symbols of their own:

Deuterium accounts for only about 15 out of every one million atoms of hydrogen. Tritium, which is radioactive, is even less abundant. All the tritium on the earth is a by-product of the decay of other radioactive elements.
Atomic weights
Atoms are of course far too small to be weighed directly; weight measurements can only be made on the massive (but unknown) numbers of atoms that are observed in chemical reactions. The early combining-weight experiments of Dalton and others established that hydrogen is the lightest of the atoms, but the crude nature of the measurements and uncertainties about the formulas of many compounds made it difficult to develop a reliable scale of the relative weights of atoms. Even the most exacting weight measurements we can make today are subject to experimental uncertainties that limit the precision to four significant figures at best.
The periodic table
The elements are arranged in a periodic table, which is probably the single most important learning aid in chemistry. It summarizes huge amounts of information about the elements in a way that facilitates the prediction of many of their properties and chemical reactions. The elements are arranged in seven horizontal rows, in order of increasing atomic number from left to right and top to bottom. The rows are called periods, and they are numbered from 1 to 7. The elements are stacked in such a way that elements with similar chemical properties form vertical columns, called groups, numbered from 1 to 18 (older periodic tables use a system based on roman numerals). Groups 1, 2, and 13–18 are the main group elements, listed as A in older tables. Groups 3–12 are in the middle of the periodic table and are the transition elements, listed as B in older tables. The two rows of 14 elements at the bottom of the periodic table are the lanthanides and the actinides, whose positions in the periodic table are indicated in group 3.
Atomic Orbitals
An orbital is the quantum mechanical refinement of Bohr’s orbit. In contrast to his concept of a simple circular orbit with a fixed radius, orbitals are mathematically derived regions of space with different probabilities of having an electron.
One way of representing electron probability distributions was illustrated in Figure 6.5.2 for the 1s orbital of hydrogen. Because Ψ2 gives the probability of finding an electron in a given volume of space (such as a cubic picometer), a plot of Ψ2 versus distance from the nucleus (r) is a plot of the probability density. The 1s orbital is spherically symmetrical, so the probability of finding a 1s electron at any given point depends only on its distance from the nucleus. The probability density is greatest at r = 0 (at the nucleus) and decreases steadily with increasing distance. At very large values of r, the electron probability density is very small but not zero.
In contrast, we can calculate the radial probability (the probability of finding a 1s electron at a distance r from the nucleus) by adding together the probabilities of an electron being at all points on a series of x spherical shells of radius r1, r2, r3,…, rx − 1, rx. In effect, we are dividing the atom into very thin concentric shells, much like the layers of an onion (part (a) in Figure 6.6.1), and calculating the probability of finding an electron on each spherical shell. Recall that the electron probability density is greatest at r = 0 (part (b) in Figure 6.6.1), so the density of dots is greatest for the smallest spherical shells in part (a) in Figure 6.6.1. In contrast, the surface area of each spherical shell is equal to 4πr2, which increases very rapidly with increasing r (part (c) in Figure 6.6.1). Because the surface area of the spherical shells increases more rapidly with increasing r than the electron probability density decreases, the plot of radial probability has a maximum at a particular distance (part (d) in Figure 6.6.1). Most important, when r is very small, the surface area of a spherical shell is so small that the total probability of finding an electron close to the nucleus is very low; at the nucleus, the electron probability vanishes (part (d) in Figure 6.6.1).

Figure 6.6.1 Most Probable Radius for the Electron in the Ground State of the Hydrogen Atom. (a) Imagine dividing the atom’s total volume into very thin concentric shells as shown in the onion drawing. (b) A plot of electron probability density Ψ2 versus r shows that the electron probability density is greatest at r = 0 and falls off smoothly with increasing r. The density of the dots is therefore greatest in the innermost shells of the onion. (c) The surface area of each shell, given by 4πr2, increases rapidly with increasing r. (d) If we count the number of dots in each spherical shell, we obtain the total probability of finding the electron at a given value of r. Because the surface area of each shell increases more rapidly with increasing r than the electron probability density decreases, a plot of electron probability versus r (the radial probability) shows a peak. This peak corresponds to the most probable radius for the electron, 52.9 pm, which is exactly the radius predicted by Bohr’s model of the hydrogen atom.
For the hydrogen atom, the peak in the radial probability plot occurs at r = 0.529 Å (52.9 pm), which is exactly the radius calculated by Bohr for the n = 1 orbit. Thus the most probable radius obtained from quantum mechanics is identical to the radius calculated by classical mechanics. In Bohr’s model, however, the electron was assumed to be at this distance 100% of the time, whereas in the Schrödinger model, it is at this distance only some of the time. The difference between the two models is attributable to the wavelike behavior of the electron and the Heisenberg uncertainty principle.
Figure 6.6.2 compares the electron probability densities for the hydrogen 1s, 2s, and 3s orbitals. Note that all three are spherically symmetrical. For the 2s and 3s orbitals, however (and for all other s orbitals as well), the electron probability density does not fall off smoothly with increasing r. Instead, a series of minima and maxima are observed in the radial probability plots (part (c) in Figure 6.6.2). The minima correspond to spherical nodes (regions of zero electron probability), which alternate with spherical regions of nonzero electron probability.
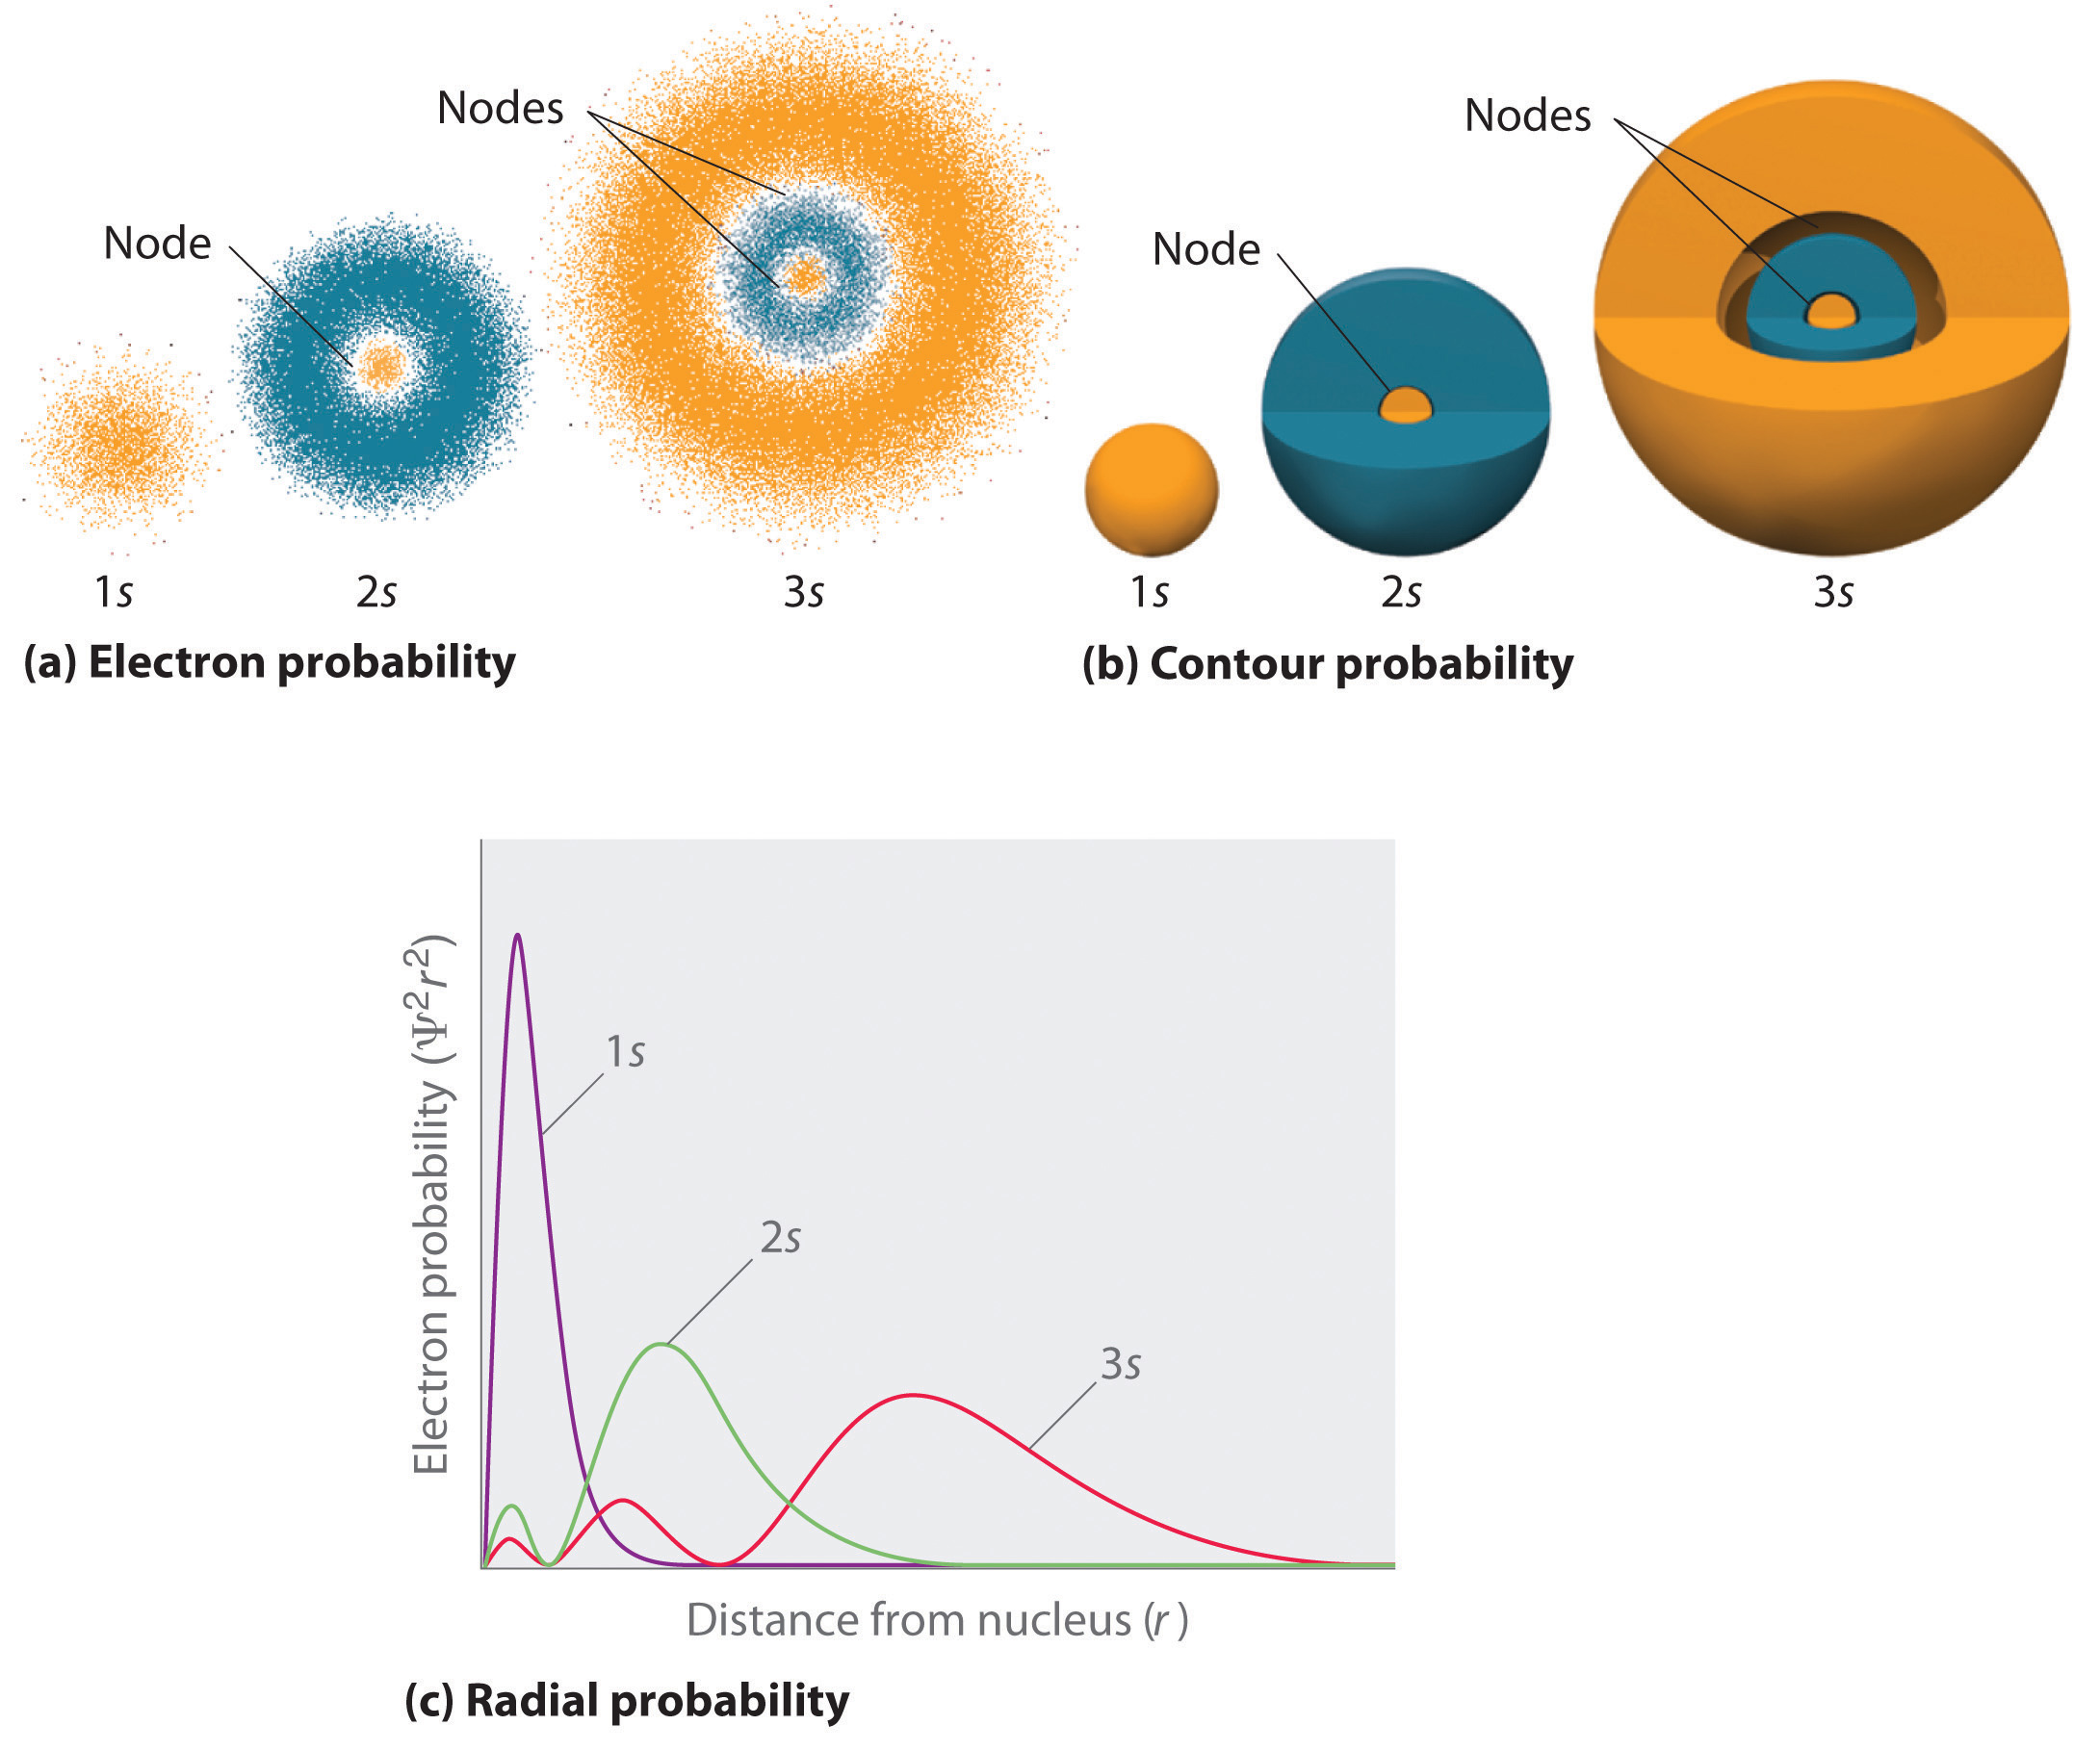
Figure 6.6.2: Probability Densities for the 1s, 2s, and 3s Orbitals of the Hydrogen Atom. (a) The electron probability density in any plane that contains the nucleus is shown. Note the presence of circular regions, or nodes, where the probability density is zero. (b) Contour surfaces enclose 90% of the electron probability, which illustrates the different sizes of the 1s, 2s, and 3s orbitals. The cutaway drawings give partial views of the internal spherical nodes. The orange color corresponds to regions of space where the phase of the wave function is positive, and the blue color corresponds to regions of space where the phase of the wave function is negative. (c) In these plots of electron probability as a function of distance from the nucleus (r) in all directions (radial probability), the most probable radius increases as n increases, but the 2s and 3s orbitals have regions of significant electron probability at small values of r.
s Orbitals
Three things happen to s orbitals as n increases (Figure 6.6.2):
- They become larger, extending farther from the nucleus.
- They contain more nodes. This is similar to a standing wave that has regions of significant amplitude separated by nodes, points with zero amplitude.
- For a given atom, the s orbitals also become higher in energy as n increases because of their increased distance from the nucleus.
Orbitals are generally drawn as three-dimensional surfaces that enclose 90% of the electron density, as was shown for the hydrogen 1s, 2s, and 3s orbitals in part (b) in Figure 6.6.2. Although such drawings show the relative sizes of the orbitals, they do not normally show the spherical nodes in the 2s and 3s orbitals because the spherical nodes lie inside the 90% surface. Fortunately, the positions of the spherical nodes are not important for chemical bonding.
p Orbitals
Only s orbitals are spherically symmetrical. As the value of l increases, the number of orbitals in a given subshell increases, and the shapes of the orbitals become more complex. Because the 2p subshell has l = 1, with three values of ml (−1, 0, and +1), there are three 2p orbitals.

Figure 6.6.3: Electron Probability Distribution for a Hydrogen 2p Orbital. The nodal plane of zero electron density separates the two lobes of the 2p orbital. As in Figure 6.6.2, the colors correspond to regions of space where the phase of the wave function is positive (orange) and negative (blue).
The electron probability distribution for one of the hydrogen 2p orbitals is shown in Figure 6.6.3. Because this orbital has two lobes of electron density arranged along the z axis, with an electron density of zero in the xy plane (i.e., the xy plane is a nodal plane), it is a 2pz orbital. As shown in Figure 6.6.4, the other two 2p orbitals have identical shapes, but they lie along the x axis (2px) and y axis (2py), respectively. Note that each p orbital has just one nodal plane. In each case, the phase of the wave function for each of the 2p orbitals is positive for the lobe that points along the positive axis and negative for the lobe that points along the negative axis. It is important to emphasize that these signs correspond to the phase of the wave that describes the electron motion, not to positive or negative charges.

Figure 6.6.4 The Three Equivalent 2p Orbitals of the Hydrogen Atom
The surfaces shown enclose 90% of the total electron probability for the 2px, 2py, and 2pz orbitals. Each orbital is oriented along the axis indicated by the subscript and a nodal plane that is perpendicular to that axis bisects each 2p orbital. The phase of the wave function is positive (orange) in the region of space where x, y, or z is positive and negative (blue) where x, y, or z is negative.
Just as with the s orbitals, the size and complexity of the p orbitals for any atom increase as the principal quantum number n increases. The shapes of the 90% probability surfaces of the 3p, 4p, and higher-energy p orbitals are, however, essentially the same as those shown in Figure 6.6.4.
The number of valence electrons
The number of valence electrons of an element can be determined by the periodic table group (vertical column) in which the element is categorized. With the exception of groups 3–12 (the transition metals), the units digit of the group number identifies how many valence electrons are associated with a neutral atom of an element listed under that particular column.
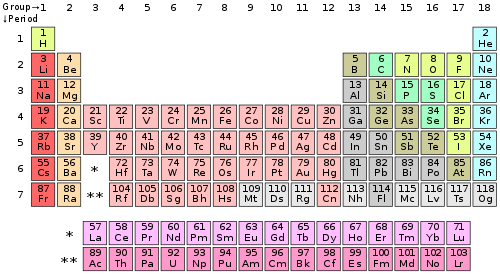
The periodic table of the chemical elements
| Periodic table group | Valence electrons |
|---|---|
| Group 1 (I) (alkali metals) | 1 |
| Group 2 (II) (alkaline earth metals) | 2 |
| Groups 3-12 (transition metals) | 2* (The 4s shell is complete and cannot hold any more electrons) |
| Group 13 (III) (boron group) | 3 |
| Group 14 (IV) (carbon group) | 4 |
| Group 15 (V) (pnictogens) | 5 |
| Group 16 (VI) (chalcogens) | 6 |
| Group 17 (VII) (halogens) | 7 |
| Group 18 (VIII or 0) (noble gases) | 8** |
* The general method for counting valence electrons is generally not useful for transition metals. Instead the modified d electron count method is used.
** Except for helium, which has only two valence electrons.
Contributors
Dr. Dietmar Kennepohl FCIC (Professor of Chemistry, Athabasca University)
Prof. Steven Farmer (Sonoma State University)
William Reusch, Professor Emeritus (Michigan State U.), Virtual Textbook of Organic Chemistry
Organic Chemistry With a Biological Emphasis by Tim Soderberg (University of Minnesota, Morris)
- Layne Morsch (University of Illinois Springfield)


