Chemistry LibreTexts

3.I.3: Particle in a Finite Potential Box (Python Notebook)

  • Page ID
    279724
  • \( \newcommand{\vecs}[1]{\overset { \scriptstyle \rightharpoonup} {\mathbf{#1}} } \) \( \newcommand{\vecd}[1]{\overset{-\!-\!\rightharpoonup}{\vphantom{a}\smash {#1}}} \)\(\newcommand{\id}{\mathrm{id}}\) \( \newcommand{\Span}{\mathrm{span}}\) \( \newcommand{\kernel}{\mathrm{null}\,}\) \( \newcommand{\range}{\mathrm{range}\,}\) \( \newcommand{\RealPart}{\mathrm{Re}}\) \( \newcommand{\ImaginaryPart}{\mathrm{Im}}\) \( \newcommand{\Argument}{\mathrm{Arg}}\) \( \newcommand{\norm}[1]{\| #1 \|}\) \( \newcommand{\inner}[2]{\langle #1, #2 \rangle}\) \( \newcommand{\Span}{\mathrm{span}}\) \(\newcommand{\id}{\mathrm{id}}\) \( \newcommand{\Span}{\mathrm{span}}\) \( \newcommand{\kernel}{\mathrm{null}\,}\) \( \newcommand{\range}{\mathrm{range}\,}\) \( \newcommand{\RealPart}{\mathrm{Re}}\) \( \newcommand{\ImaginaryPart}{\mathrm{Im}}\) \( \newcommand{\Argument}{\mathrm{Arg}}\) \( \newcommand{\norm}[1]{\| #1 \|}\) \( \newcommand{\inner}[2]{\langle #1, #2 \rangle}\) \( \newcommand{\Span}{\mathrm{span}}\)\(\newcommand{\AA}{\unicode[.8,0]{x212B}}\)

    Defining the Problem

    Consider the case in which the walls do not have infinite Potential height. Instead, they reach a maximum, finite value, \(V_o\) eV.

    download.png
    Figure \(\PageIndex{1}\): Regions in the particle in a box with finite potential model

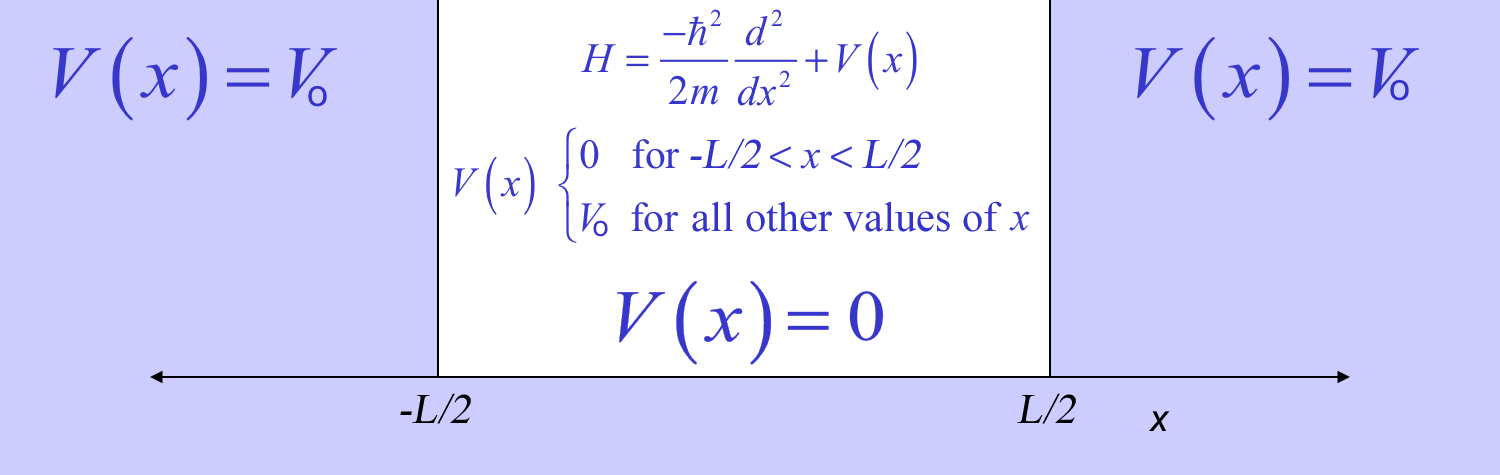
    The Schrödinger Equation and Solutions

    Behavior inside the Box

    \[ \dfrac{d^2\psi(x)}{d x^2} = -\dfrac{2mE}{\hbar^2} \psi(x) =-k^2 \psi(x) \nonumber \]

    Solutions have the general form of

    \[\psi(x) = e^{\pm ikx} \nonumber\]

    Therefore:

    \[\psi(x) = q_1 \cos(kx) + q_2 \sin(kx) \nonumber\]

    Behavior outside the Box

    \[\dfrac{d^2\psi(x)}{d x^2} = -\dfrac{2m(E-V_o)}{\hbar^2}\psi(x) \nonumber\]

    • If \(E>V_o\), the particle is unbounded and the particle moves freely above the walls (like a free particle discussed previously).
    • If \(E<V_o\), the particle is bounded and within the walls (i.e., like a particle trapped in a box discussed previously)

    Connecting the two Behaviors

    For \(E<V_o\), it is really interesting to look at what happens outside the walls.

    When \(E<V_o\), the Schrödinger equation becomes

    \[\large{\frac{\partial^2\psi(x)}{\partial x^2}} = \alpha_o^2\cdot \psi(x) \nonumber\]

    since

    \[\alpha_o^2 = \frac{2m(V_o-E)}{\hbar^2} >0.\]

    The solutions to this equation have the general form of

    \[\psi(x) =e^{\pm\alpha_o x}. \nonumber\]

    Note that the exponential function does not require an imaginary component, thus it is not oscillatory. Before we move on, here are some questions to consider:

    Exercise \(\PageIndex{1}\)

    • Q1: Can you test if this is a solution to the differential equation?
    • Q2 Can you write the general solution for a particle outside the box.
    • Q3: What is the value of \(\alpha_o\)?
    • Q4: Given that \(\psi(x)\) must be finite, how would this constrain the solutions for \(x\rightarrow -\infty\)?
    • Q5: Given that \(\psi(x)\) must be finite, how would this constrain the solutions for \(x\rightarrow \infty\)?

    From the general solutions, and applying those constrains, we can consider three distinct regions (Figure \(\PageIndex{1}\)). In each region the wavefunction for \(E<V_o\) will be:

    \[\begin{array} {llcl} I: & V(x) = Vo & \hspace 0.75 cm x \leq-\frac{L}{2} & \hspace 0.75 cm\psi_{I} = A e^{\alpha_o x} \\ II: & V(x) = 0 & \hspace 0.75 cm-\frac{L}{2} \leq x \leq\frac{L}{2} & \hspace 0.75 cm\psi_{II} = B \cos(k x) + C \sin(k x)\\ III: & V(x) =Vo &\hspace 0.75 cm x \geq \frac{L}{2} &\hspace 0.75 cm \psi_{III} = D e^{-\alpha_o x}\end{array} \]

    where \(\alpha_o = \frac{\sqrt{2m(V_o-E)}}{\hbar}\) and \(k = \frac{\sqrt{2mE}}{\hbar}\).

    The wavefunction must obey the following boundary conditions:

    \[\begin{align*} \psi_{I}\left(-\frac{L}{2}\right) &= \psi_{II}\left(-\frac{L}{2}\right) \\[4pt] \psi_{II}\left(\frac{L}{2}\right) &= \psi_{III}\left(\frac{L}{2}\right) \\[4pt] \psi^{'}_{I}\left(-\frac{L}{2}\right) &= \psi^{'}_{II}\left(-\frac{L}{2}\right) \\[4pt]\psi^{'}_{II}\left(\frac{L}{2}\right) &= \psi^{'}_{III}\left(\frac{L}{2}\right) \end{align*}\]

    where the symbol \('\) corresponds to the first derivative with respect to \(x\) (\(\psi^{'} = \frac{d\psi}{dx}\)).

    Note

    \(\psi^{'}\) needs to be continuous to guarantee the existence of \(\psi^{''}\), whose existence is required from the first postulate. \(\large{\frac{d^2}{dx^2}}\) is a component of the kinetic energy operator. If the wavefunction does not have a well-defined second derivative, then the kinetic energy would be undefined, which is not possible.

    It can be shown that when the potential is even (\(V(-x) = V(x)\)), the wavefunctions can be either even (\(\psi(-x) = \psi(x)]\)) or odd (\([\psi(-x) = -\psi(x)\)).
    On the way the potential is written, we are considering that the particle is in a finite box with an even potential. Thus, even and odd solutions of the wavefunction can be found independently:

    Even solutions

    \[\begin{array} {ll} \text{For } x \leq-\frac{L}{2}: & \psi_{I}(x) = D e^{\alpha_o x} \\ \text{For } -\frac{L}{2} \leq x \leq\frac{L}{2}: & \psi_{II}(x) = B \cos(k x) \\ \text{For } x \geq \frac{L}{2}: & \psi_{III}(x) = D e^{-\alpha_o x}\end{array}\] After imposing the boundary conditions we reach the following relation: \[\alpha_o = k\tan\left(k\frac{L}{2}\right)\hspace 1cm \Rightarrow \hspace 1cm \sqrt{V_o-E} = \sqrt{E}\tan\left(\frac{L\sqrt{2mE}}{2\hbar}\right) \label{2}\]

    Odd solutions

    \[\begin{array} {ll} \text{For } x \leq-\frac{L}{2}: & \psi_{I}(x) = -D e^{\alpha_o x} \\ \text{For } -\frac{L}{2} \leq x \leq\frac{L}{2}: & \psi_{II}(x) = C \sin(k x) \\ \text{For } x \geq \frac{L}{2}: & \psi_{III}(x) = D e^{-\alpha_o x}\end{array} \] After imposing the boundary conditions we reach the following relation: \[\alpha_o = -\frac{k}{\tan\left(k\frac{L}{2}\right)} \hspace 1cm \Rightarrow \hspace 1cm \sqrt{V_o-E} = -\frac{\sqrt{E}}{\tan\left(\frac{L\sqrt{2mE}}{2\hbar}\right)}\label{3}\]

    The actual solutions will be those corresponding to energies that obey Equations \ref{2} and \ref{3}. Once we find the allowed energies, we can go back and obtain the wavefunctions with the proper coefficients.

    Finding the allowed Energies Graphically

    Unfortunately, we cannot find the allowed energies analytically. Instead we can do it graphically (first) or numerically (later). That is: we can graph the left and right hand side Equations \ref{2} and \ref{3} and look for the intersection points. Those will correspond to the allowed energy values.

    Finding Allowed Energies
    import matplotlib.pyplot as plt
    import numpy as np
    
    # Reading the input variables from the user
    Vo = float(input("Enter the value for Vo (in eV) = "))
    L =  float(input("Enter the value for L (in Angstroms) = "))
    
    val = np.sqrt(2.0*9.10938356e-31*1.60217662e-19)*1e-10/(2.0*1.05457180013e-34) # equal to sqrt(2m*1eV)*1A/(2*hbar)
    
    # Generating the graph
    plt.rcParams.update({'font.size': 18, 'font.family': 'STIXGeneral', 'mathtext.fontset': 'stix'})
    fig, axes = plt.subplots(1, 2, figsize=(13,4))
    axes[0].axis([0.0,Vo,0.0,np.sqrt(Vo)*1.8])
    axes[0].set_xlabel(r'$E$ (eV)')
    axes[0].set_ylabel(r'(eV$^{-1}$)')
    axes[0].set_title('Even solutions')
    axes[1].axis([0.0,Vo,0.0,np.sqrt(Vo)*1.8])
    axes[1].set_xlabel(r'$E$ (eV)')
    axes[1].set_ylabel(r'')
    axes[1].set_title('Odd solutions')
    E = np.linspace(0.0, Vo, 10000)
    num = int(round((L*np.sqrt(Vo)*val-np.pi/2.0)/np.pi))
    # Removing discontinuity points
    for n in range(10000):
        for m in range(num+2):
            if abs(E[n]-((2.0*float(m)+1.0)*np.pi/(2.0*L*val))**2)<0.01: E[n] = np.nan
            if abs(E[n]-(float(m)*np.pi/(L*val))**2)<0.01: E[n] = np.nan
    # Plotting the curves and setting the labels
    axes[0].plot(E, np.sqrt(Vo-E), label=r"$\sqrt{V_o-E}$", color="blue", linewidth=1.8)
    axes[0].plot(E, np.sqrt(E)*np.tan(L*np.sqrt(E)*val), label=r"$\sqrt{E}\tan(\frac{L\sqrt{2mE}}{2\hbar})$", color="red", linewidth=1.8)
    axes[1].plot(E, np.sqrt(Vo-E), label=r"$\sqrt{V_o-E}$", color="blue", linewidth=1.8)
    axes[1].plot(E, -np.sqrt(E)/np.tan(L*np.sqrt(E)*val), label=r"$-\frac{\sqrt{E}}{\tan(\frac{L\sqrt{2mE}}{2\hbar})}$", color="red", linewidth=1.8)
    # Chosing the positions of the legends
    axes[0].legend(bbox_to_anchor=(0.05, -0.2), loc=2, borderaxespad=0.0)
    axes[1].legend(bbox_to_anchor=(0.05, -0.2), loc=2, borderaxespad=0.0)
    
    # Show the plots on the screen once the code reaches this point
    plt.show()

    The allowed values would then be the values of \(E\) in which the two curves cross. Here are some question to think about:

    Exercise \(\PageIndex{1}\)

    • Q1: How many bound states are possible?
    • Q2: How many bound states are even and how many are odd?
    • Q3: Is the ground state described by an even or an odd wavefunction?
    • Q4: Can you read accuretely the allowed values of energy from these graphs?

    The allowed values of \(E\) can be found by numerically, yielding:

    Allowed Energies
    import numpy as np
    
    print ("The allowed bounded energies are:")
    # We want to find the values of E in which f_even and f_odd are zero
    f_even = lambda E : np.sqrt(Vo-E)-np.sqrt(E)*np.tan(L*np.sqrt(E)*val)
    f_odd = lambda E : np.sqrt(Vo-E)+np.sqrt(E)/np.tan(L*np.sqrt(E)*val)
    E_old = 0.0
    f_even_old = f_even(0.0)
    f_odd_old = f_odd(0.0)
    n = 1
    E_vals = np.zeros(999)
    # Here we loop from E = 0 to E = Vo seeking roots
    for E in np.linspace(0.0, Vo, 200000):
        f_even_now = f_even(E)
        # If the difference is zero or if it changes sign then we might have passed through a root
        if f_even_now == 0.0 or f_even_now/f_even_old < 0.0:
            # If the old values of f are not close to zero, this means we didn't pass through a root but
            # through a discontinuity point
            if (abs(f_even_now)<1.0 and abs(f_even_old)<1.0):
                E_vals[n-1] = (E+E_old)/2.0
                print "  State #%3d (Even wavefunction): %9.4f eV, %13.6g J" % (n,E_vals[n-1],E_vals[n-1]*1.60217662e-19)
                n += 1
        f_odd_now = f_odd(E)
        # If the difference is zero or if it changes sign then we might have passed through a root
        if f_odd_now == 0.0 or f_odd_now/f_odd_old < 0.0:
            # If the old values of f are not close to zero, this means we didn't pass through a root but
            # through a discontinuity point
            if (abs(f_odd_now)<1.0 and abs(f_odd_old)<1.0):
                E_vals[n-1] = (E+E_old)/2.0
                print "  State #%3d  (Odd wavefunction): %9.4f eV, %13.6g J" % (n,E_vals[n-1],E_vals[n-1]*1.60217662e-19)
                n += 1
        E_old = E
        f_even_old = f_even_now
        f_odd_old = f_odd_now
    nstates = n-1
    print ("\nTHERE ARE %3d POSSIBLE BOUNDED ENERGIES" % nstates)

    We can now plot these energy values as a diagram. Plotting an Energy Diagram helps us to see the energy separation between the states.

    Energy Diagram
    import matplotlib.pyplot as plt
    
    # Generating the energy diagram
    fig, ax = plt.subplots(figsize=(8,12))
    ax.spines['right'].set_color('none')
    ax.yaxis.tick_left()
    ax.spines['bottom'].set_color('none')
    ax.axes.get_xaxis().set_visible(False)
    ax.spines['top'].set_color('none')
    ax.axis([0.0,10.0,0.0,1.1*Vo])
    ax.set_ylabel(r'$E_n$ (eV)')
    for n in range(1,nstates+1):
        str1="$n = "+str(n)+r"$, $E_"+str(n)+r" = %.3f$ eV"%(E_vals[n-1])
        ax.text(6.5, E_vals[n-1]-0.005*Vo, str1, fontsize=16, color="red")
        ax.hlines(E_vals[n-1], 0.0, 6.3, linewidth=1.8, linestyle='--', color="red")
    str1="$V_o = %.3f$ eV"%(Vo)
    ax.text(6.5, Vo-0.01*Vo, str1, fontsize=16, color="blue")
    ax.hlines(Vo, 0.0, 6.3, linewidth=3.8, linestyle='-', color="blue")
    ax.hlines(0.0, 0.0, 10.3, linewidth=1.8, linestyle='-', color="black")
    plt.title("Energy Levels", fontsize=30)
    plt.show()
    Enter the value for Vo (in eV) = 
    Enter the value for L (in Angstroms) = 


    We can plug the values of \(E\) back into the wavefunction expressions and plot the wavefunctions together with their corresponding probability densities.

    Wavefunctions and Probability Densities
    import matplotlib.pyplot as plt
    import numpy as np
    
    print ("\nThe bound wavefunctions are:")
    fig, ax = plt.subplots(figsize=(12,9))
    ax.spines['right'].set_color('none')
    ax.xaxis.tick_bottom()
    ax.spines['left'].set_color('none')
    ax.axes.get_yaxis().set_visible(False)
    ax.spines['top'].set_color('none')
    X_lef = np.linspace(-L, -L/2.0, 900,endpoint=True)
    X_mid = np.linspace(-L/2.0, L/2.0, 900,endpoint=True)
    X_rig = np.linspace(L/2.0, L, 900,endpoint=True)
    ax.axis([-L,L,0.0,1.1*Vo])
    ax.set_xlabel(r'$X$ (Angstroms)')
    str1="$V_o = %.3f$ eV"%(Vo)
    ax.text(2.0*L/2.0, 1.02*Vo, str1, fontsize=24, color="blue")
    # Defining the maximum amplitude of the wavefunction
    if (nstates > 1):
        amp = np.sqrt((E_vals[1]-E_vals[0])/1.5)
    else:
        amp = np.sqrt((Vo-E_vals[0])/1.5)
    # Plotting the wavefunctions
    for n in range(1,nstates+1):
        ax.hlines(E_vals[n-1], -L, L, linewidth=1.8, linestyle='--', color="black")
        str1="$n = "+str(n)+r"$, $E_"+str(n)+r" = %.3f$ eV"%(E_vals[n-1])
        ax.text(2.0*L/2.0, E_vals[n-1]+0.01*Vo, str1, fontsize=16, color="red")
        k = 2.0*np.sqrt(E_vals[n-1])*val
        a0 = 2.0*np.sqrt(Vo-E_vals[n-1])*val
        # Plotting odd wavefunction
        if (n%2==0):
            ax.plot(X_lef,E_vals[n-1]-amp*np.exp(a0*L/2.0)*np.sin(k*L/2.0)*np.exp(a0*X_lef), color="red", label="", linewidth=2.8)
            ax.plot(X_mid,E_vals[n-1]+amp*np.sin(k*X_mid), color="red", label="", linewidth=2.8)
            ax.plot(X_rig,E_vals[n-1]+amp*np.exp(a0*L/2.0)*np.sin(k*L/2.0)*np.exp(-a0*X_rig), color="red", label="", linewidth=2.8)
        # Plotting even wavefunction
        else:
            ax.plot(X_lef,E_vals[n-1]+amp*np.exp(a0*L/2.0)*np.cos(k*L/2.0)*np.exp(a0*X_lef), color="red", label="", linewidth=2.8)
            ax.plot(X_mid,E_vals[n-1]+amp*np.cos(k*X_mid), color="red", label="", linewidth=2.8)
            ax.plot(X_rig,E_vals[n-1]+amp*np.exp(a0*L/2.0)*np.cos(k*L/2.0)*np.exp(-a0*X_rig), color="red", label="", linewidth=2.8)
    ax.margins(0.00)
    ax.vlines(-L/2.0, 0.0, Vo, linewidth=4.8, color="blue")
    ax.vlines(L/2.0, 0.0, Vo, linewidth=4.8, color="blue")
    ax.hlines(0.0, -L/2.0, L/2.0, linewidth=4.8, color="blue")
    ax.hlines(Vo, -L, -L/2.0, linewidth=4.8, color="blue")
    ax.hlines(Vo, L/2.0, L, linewidth=4.8, color="blue")
    plt.title('Wavefunctions', fontsize=30)
    plt.legend(bbox_to_anchor=(0.8, 1), loc=2, borderaxespad=0.)
    plt.show()

    The bound wavefunctions are:

    Bound Wavefunctions
    import matplotlib.pyplot as plt
    import numpy as np
    
    print ("\nThe bound Probability Densities are shown below \nwith the areas shaded in green showing the regions where the particle can tunnel outside the box")
    fig, ax = plt.subplots(figsize=(12,9))
    ax.spines['right'].set_color('none')
    ax.xaxis.tick_bottom()
    ax.spines['left'].set_color('none')
    ax.axes.get_yaxis().set_visible(False)
    ax.spines['top'].set_color('none')
    X_lef = np.linspace(-L, -L/2.0, 900,endpoint=True)
    X_mid = np.linspace(-L/2.0, L/2.0, 900,endpoint=True)
    X_rig = np.linspace(L/2.0, L, 900,endpoint=True)
    ax.axis([-L,L,0.0,1.1*Vo])
    ax.set_xlabel(r'$X$ (Angstroms)')
    str1="$V_o = %.3f$ eV"%(Vo)
    ax.text(2.05*L/2.0, 1.02*Vo, str1, fontsize=24, color="blue")
    # Defining the maximum amplitude of the probability density
    if (nstates > 1):
        amp = (E_vals[1]-E_vals[0])/1.5
    else:
        amp = (Vo-E_vals[0])/1.5
    # Plotting the probability densities
    for n in range(1,nstates+1):
        ax.hlines(E_vals[n-1], -L, L, linewidth=1.8, linestyle='--', color="black")
        str1="$n = "+str(n)+r"$, $E_"+str(n)+r" = %.3f$ eV"%(E_vals[n-1])
        ax.text(2.0*L/2.0, E_vals[n-1]+0.01*Vo, str1, fontsize=16, color="red")
        k = 2.0*np.sqrt(E_vals[n-1])*val
        a0 = 2.0*np.sqrt(Vo-E_vals[n-1])*val
        # Plotting odd probability densities
        if (n%2==0):
            Y_lef = E_vals[n-1]+amp*(np.exp(a0*L/2.0)*np.sin(k*L/2.0)*np.exp(a0*X_lef))**2
            ax.plot(X_lef,Y_lef, color="red", label="", linewidth=2.8)
            ax.fill_between(X_lef, E_vals[n-1], Y_lef, color="#3dbb2a")
            ax.plot(X_mid,E_vals[n-1]+amp*(np.sin(k*X_mid))**2, color="red", label="", linewidth=2.8)
            Y_rig = E_vals[n-1]+amp*(np.exp(a0*L/2.0)*np.sin(k*L/2.0)*np.exp(-a0*X_rig))**2
            ax.plot(X_rig,Y_rig, color="red", label="", linewidth=2.8)
            ax.fill_between(X_rig, E_vals[n-1], Y_rig, color="#3dbb2a")
        # Plotting even probability densities
        else:
            Y_lef = E_vals[n-1]+amp*(np.exp(a0*L/2.0)*np.cos(k*L/2.0)*np.exp(a0*X_lef))**2
            ax.plot(X_lef,Y_lef, color="red", label="", linewidth=2.8)
            ax.fill_between(X_lef, E_vals[n-1], Y_lef, color="#3dbb2a")
            ax.plot(X_mid,E_vals[n-1]+amp*(np.cos(k*X_mid))**2, color="red", label="", linewidth=2.8)
            Y_rig = E_vals[n-1]+amp*(np.exp(a0*L/2.0)*np.cos(k*L/2.0)*np.exp(-a0*X_rig))**2
            ax.plot(X_rig,Y_rig, color="red", label="", linewidth=2.8)
            ax.fill_between(X_rig, E_vals[n-1], Y_rig, color="#3dbb2a")
    ax.margins(0.00)
    ax.vlines(-L/2.0, 0.0, Vo, linewidth=4.8, color="blue")
    ax.vlines(L/2.0, 0.0, Vo, linewidth=4.8, color="blue")
    ax.hlines(0.0, -L/2.0, L/2.0, linewidth=4.8, color="blue")
    ax.hlines(Vo, -L, -L/2.0, linewidth=4.8, color="blue")
    ax.hlines(Vo, L/2.0, L, linewidth=4.8, color="blue")
    plt.title('Probability Densities', fontsize=30)
    plt.legend(bbox_to_anchor=(0.8, 1), loc=2, borderaxespad=0.)
    plt.show()

    The bound Probability Densities are shown below with the areas shaded in green showing the regions where the particle can tunnel outside the box

    Tunneling

    If we compare these results with those of a particle in a box of same size but with infinite potential, we conclude that in the finite box, the levels are shifted to lower energies. More strikingly is the observation that the wavefunctions and the probability densities have non-zero values outside the box limits.

    Classically, the particle cannot be found outside the box because the available energy is lower than the potential wall (\(E < V_o\)). However, for the particle in the finite box the wavefunction is nonzero outside the box, which means that there is a possibility of finding the particle outside the box. This is a pure quantum effect called the tunneling effect.

    The tunneling probability correspond to the area outside the box that has non-zero values of probability density. In the graphically representation, those areas are shaded in green. The integration of those areas provide the probability that the particle will tunnel outside the classically allowed region.

    \[ \large{\dfrac{\displaystyle \int^{\frac{-L}{2}}_{-\infty} |\psi(x)|^2\ dx + \displaystyle \int^{+\infty}_{\frac{L}{2}} |\psi(x)|^2\ dx }{\displaystyle \int_{-\infty}^{+\infty} |\psi(x)|^2\ dx }}\]

    where the denominator is 1 for a normalized wavefunction.

    This integral can be solved analytically (for the even and for the odd solutions). The tunneling probability for each state is:

    Tunneling Probabilities
    import numpy as np
    
    print ("\nThe tunneling probabilities are:")
    for n in range(1,nstates+1):
        k = 2.0*np.sqrt(E_vals[n-1])*val
        a0 = 2.0*np.sqrt(Vo-E_vals[n-1])*val
        # For odd solution
        if (n%2==0):
            C = 1.0
            D = np.exp(a0*L/2.0)*np.sin(k*L/2.0)*C
            prob = D*D*2.0*k*np.exp(-a0*L)/(B*B*a0*(k*L-np.sin(k*L))+D*D*2.0*k*np.exp(-a0*L))
        # For even solution
        else:
            B = 1.0
            D = np.exp(a0*L/2.0)*np.cos(k*L/2.0)*B
            prob = D*D*2.0*k*np.exp(-a0*L)/(B*B*a0*(k*L+np.sin(k*L))+D*D*2.0*k*np.exp(-a0*L))
        print "  State #%3d tunneling probability = %5.2f%%" % (n,100*prob)

    These evaluation and graphical representations show that the tunneling probability increases as the energy of the particle increases. This behavior is expected because, the higher the energy is, the lower the difference \(V_o-E\) is, thus it becomes easier for the tunneling to happen. In other words, the closer the state is to the top of the potential barrier, the easier it is to spread outside.

    Try evaluating these tunneling probabilities for different heights of the walls (different \(V_o\) values). Do you expect the number of bound states to increase or decrease as \(V_o\) increases?

    We are now ready to tackle "Particle in a box with two finite-potential external walls and a barrier between them"


    This page titled 3.I.3: Particle in a Finite Potential Box (Python Notebook) is shared under a not declared license and was authored, remixed, and/or curated by Vinícius Wilian D. Cruzeiro, Xiang Gao, and Valeria D. Kleiman.