7.2: Atomic Spectra
- Page ID
- 37015
- To know the relationship between atomic spectra and the electronic structure of atoms.
The photoelectric effect provided indisputable evidence for the existence of the photon and thus the particle-like behavior of electromagnetic radiation. The concept of the photon, however, emerged from experimentation with thermal radiation, electromagnetic radiation emitted as the result of a source’s temperature, which produces a continuous spectrum of energies. More direct evidence was needed to verify the quantized nature of electromagnetic radiation. In this section, we describe how experimentation with visible light provided this evidence.
Line Spectra
Although objects at high temperature emit a continuous spectrum of electromagnetic radiation, a different kind of spectrum is observed when pure samples of individual elements are heated. For example, when a high-voltage electrical discharge is passed through a sample of hydrogen gas at low pressure, the resulting individual isolated hydrogen atoms caused by the dissociation of H2 emit a red light. Unlike blackbody radiation, the color of the light emitted by the hydrogen atoms does not depend greatly on the temperature of the gas in the tube. When the emitted light is passed through a prism, only a few narrow lines, called a line spectrum, which is a spectrum in which light of only a certain wavelength is emitted or absorbed, rather than a continuous range of wavelengths (Figure \(\PageIndex{1}\)), rather than a continuous range of colors. The light emitted by hydrogen atoms is red because, of its four characteristic lines, the most intense line in its spectrum is in the red portion of the visible spectrum, at 656 nm. With sodium, however, we observe a yellow color because the most intense lines in its spectrum are in the yellow portion of the spectrum, at about 589 nm.


Such emission spectra were observed for many other elements in the late 19th century, which presented a major challenge because classical physics was unable to explain them. Part of the explanation is provided by the observation of only a few values of λ (or ν) in the line spectrum meant that only a few values of E were possible. Thus the energy levels of a hydrogen atom had to be quantized; in other words, only states that had certain values of energy were possible, or allowed. If a hydrogen atom could have any value of energy, then a continuous spectrum would have been observed, similar to blackbody radiation.
In 1885, a Swiss mathematics teacher, Johann Balmer (1825–1898), showed that the frequencies of the lines observed in the visible region of the spectrum of hydrogen fit a simple equation that can be expressed as follows:
\[ u=constant\; \left ( \dfrac{1}{2^{2}}-\dfrac{1}{n^{^{2}}} \right ) \label{\(\PageIndex{1}\)}\]
where n = 3, 4, 5, 6. As a result, these lines are known as the Balmer series. The Swedish physicist Johannes Rydberg (1854–1919) subsequently restated and expanded Balmer’s result in the Rydberg equation:
\[ \dfrac{1}{\lambda }=\Re\; \left ( \dfrac{1}{n^{2}_{1}}-\dfrac{1}{n^{2}_{2}} \right ) \label{\(\PageIndex{2}\)}\]
where \(n_1\) and \(n_2\) are positive integers, \(n_2 > n_1\), and \( \Re \) the Rydberg constant, has a value of 1.09737 × 10⁷ m−1.
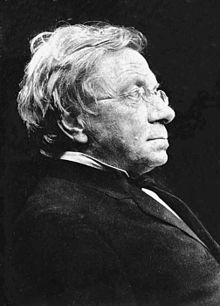
A mathematics teacher at a secondary school for girls in Switzerland, Balmer was 60 years old when he wrote the paper on the spectral lines of hydrogen that made him famous.

Balmer published only one other paper on the topic, which appeared when he was 72 years old.
Like Balmer’s equation, Rydberg’s simple equation described the wavelengths of the visible lines in the emission spectrum of hydrogen (with n1 = 2, n2 = 3, 4, 5,…). More important, Rydberg’s equation also described the wavelengths of other series of lines that would be observed in the emission spectrum of hydrogen: one in the ultraviolet (n1 = 1, n2 = 2, 3, 4,…) and one in the infrared (n1 = 3, n2 = 4, 5, 6). Unfortunately, scientists had not yet developed any theoretical justification for an equation of this form.
The Bohr Atom: https://youtu.be/GuFQEOzFOgA
Summary
There is an intimate connection between the atomic structure of an atom and its spectral characteristics. Most light is polychromatic and contains light of many wavelengths. Light that has only a single wavelength is monochromatic and is produced by devices called lasers, which use transitions between two atomic energy levels to produce light in a very narrow range of wavelengths. Atoms can also absorb light of certain energies, resulting in a transition from the ground state or a lower-energy excited state to a higher-energy excited state. This produces an absorption spectrum, which has dark lines in the same position as the bright lines in the emission spectrum of an element.
Atoms of individual elements emit light at only specific wavelengths, producing a line spectrum rather than the continuous spectrum of all wavelengths produced by a hot object. Niels Bohr explained the line spectrum of the hydrogen atom by assuming that the electron moved in circular orbits and that orbits with only certain radii were allowed. Lines in the spectrum were due to transitions in which an electron moved from a higher-energy orbit with a larger radius to a lower-energy orbit with smaller radius. The orbit closest to the nucleus represented the ground state of the atom and was most stable; orbits farther away were higher-energy excited states. Transitions from an excited state to a lower-energy state resulted in the emission of light with only a limited number of wavelengths. Bohr’s model could not, however, explain the spectra of atoms heavier than hydrogen.
Contributors and Attributions
Modified by Joshua Halpern (Howard University)

