
1: Experiment 1 - Measurements
- Page ID
- 212557
Measurements and the Irrational Number Pi
Ancillary Documents
- Google Doc Experiment 1 Design Proposal
- Google Doc Measurements Worksheet
- Google Sheet Graphs Template
- Google Form Measurements Lab Report
Learning Objectives
Content:
- Measurements
- Unit Conversions
- Uncertainty in measurements
- Accuracy and Precision
- Significant Digits
- Graphing linear functions
Process:
- Develop a scale of length based on width of students thumb
- Design an experiment to calculate pi using a scale based on a student's thumb
- Graph Data to determine the slope of a line
- by hand
- with a spreadsheet
- Analyze data for random and systematic error
- Develop conversion factors between scales based on different student's thumbs
Prior Knowledge:
Introduction
In this lab students will work in online groups of four using Zoom breakout groups to discuss Google Docs, and will create scales based on the width of the thumb to determine the value of pi. The first scale will be the hand scale, which is equal to the width of 5 thumbs. Once this scale is completed, students will then create a more precise scale, the decihand scale, where each unit is 1/10th the length of the hand scale. After creating this scales students will then find 5 circular objects around their house, measure the circumference and diameter, and then use Google Sheets to plot these measurements and determine the value of pi.
- Day 1: Students work in their group to design an experiment to get the data to calculate Pi.
- Day 2: Each student individually performs the experiment and builds graphs in Google Sheets.
- Day 3: Students share their data with their class mates and build a graph that includes data from all teammates.
Supplies:
In this lab you may need to obtain supplies, if you go to the store be sure to follow proper COVID-19 hygienic protocols, wear a mask, wash your hands thoroughly and maintain safe distance from fellow shoppers. Please review these protocols from the CDC.
- two strings or shoe laces that can be marked on
- Red and blue markers
- metric ruler
- firm paper (thin cardboard from packaging can be used)
- Scissors
- cell phone with camera
- laptop or computer with camera, speakers and microphone hooked up to internet
- Scotch tape
Protocols
May 27, 2020
You will be added to a Zoom breakout room where you will need to work with your team to complete the Measurements Worksheet. Make sure that all team members are participating and contributing to the assignment.
Interactive Element
Measurements Worksheet
Using Zoom Breakout groups collaboratively work with your online group on the Google Doc in your Google Classroom called "Experiment 1: Measurements Design Proposal". You need to develop a protocol for building a ruler based on the width of your thumb. As you will be measuring the circumference of a circular object the "ruler" needs to be made of a flexible material, like a string or an power cord. You will make two different scales, both based on the same fundamental unit of length, which we will call a "hand" as is 5 times the length of your thumb.
- Hand Scale: Each mark on this scale will be the length of 5 thumbs, and we will call this unit a "hand". Mark these with a unique color, and make it at least 3 hands in length (it needs to be longer than the circumference of the largest item you measure), and so there will be a minimum of 4 marks (of lengths 0,1,2,3...)
- Decihand Scale: There will be an additional 9 equally spaced marks between each "hand" of the first scale, and these need to be of a different color than the marks that indicate a hand. So this scale has has two marks, a hand (which is every 10 decihands), and a decihand (which is 1/10th of a hand. A scale that is 3 hands in length will have 4 marks of one color that indicate the hand, and 27 marks of another color
Note
Students need to make two scales, and upload a picture of the two scales to their worksheet in Google Classroom. These scales are based on the same unit of length (the length of 5 thumbs, which we will call the "hand"), but have different precision. When making measurements students must report the correct number of significant digits (all certain values and the first "guesstimate", section 1B.2.1.2 of your LibreText).
Figure \(\PageIndex{1}\) can give you some ideas on how to proceed, but be creative. You need to think of systematic error, both in how you make your scale, and in how you use your scale.
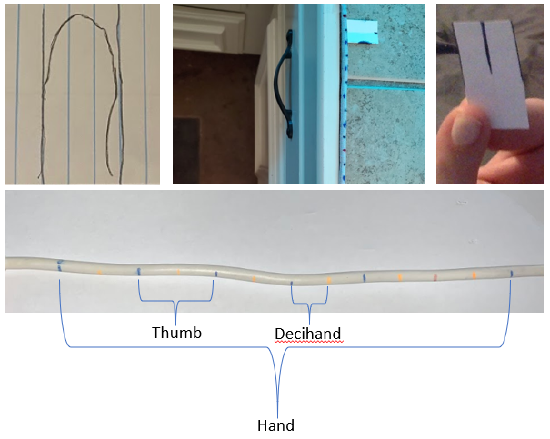 Figure \(\PageIndex{1}\): Some ideas on how to proceed in making the Decihand scale
Interactive Element
Experiment 1: Measurements Design Proposal
Now go around your house and find 5 circular objects of varying sizes using the following guidelines.
- Circumference of the smallest object must be less than one hand.
- Diameter of largest object must be greater than one hand
May 28, 2020
Part 1. Take a picture of your supplies.
- 5 circular objects
- one with a diameter longer than twice the width of your hand (dinner plate?)
- one with a circumference smaller than than three times the width of your thumb (large coin?)
- the others of as varied of sizes as possible
- Piece of string longer than the circumference of the largest circular object
- Tape
- Scissors
- 2 colors of markers (lets say red and blue)
- several sheets of paper and a counter to work on.
Part 2. Develop the base unit of your thumb scale
- Take a piece of paper and draw a line perpendicular to the edge of a paper. Press your thumb down such that the right side of your thumb just touches the line and trace your thumb on the piece of paper.
- Make another line that just touches the left side of the outline of your thumb and is parallel to the first line (perpendicular to the edge of the paper).
Take a Picture of this outline and submit with your lab report - With a pair of scissors cut out a rectangle from the paper such that the length of the side on the edge of the paper is the width of your thumb.
Part 3. Make two scales.
- Cut two pieces of string that are longer than the circumference of the larges object.
- Tape one end of each string to a flat surface that is longer than the string, with the two strings being parallel to each other and the pull the other end of the strings so are taught and form a straight line, and then tape the other end so you now have to straight strings running side by side.
- At one end of both strings make a mark and this is the zero point (use the red marker for zero). You may want to put another piece of paper under the strings as you mark them, so you do not mark the surface they are taped to.
- Take your "thumb" from part 2 and starting from the red zero mark make 4 blue marks, with the 5th being red. Repeat this sequence for the length of the string such that the 5th, 10th, 15th,... mark is a different color than the others (we are saying red, but the choice of color is up to you)
Hand Scale
Now take the red marker on the second string (that has no thumbs) and make a red mark every 5 thumbs (if they are taped next to each other you can simple use the first string to measure where the marks are. This is the "hand" scale, and we are saying there are five thumbs to a hand.
Decihand Scale
Now go to the first scale (with both red and blue marks) and between each mark make another blue mark, so that there are 9 equaly spaced blue marks between each red mark. So each of the blue marks is 1/10th the distance of a red mark, and this would be a decihand. Note, you can fold the piece of paper you used to determine the length of a thumb in half and use that to mark of these distances. To avoid systematic error in making your scale you may want to alternate adding or subtracting this from the existing marks. That is, after adding it to your zero mark you could add and subtract from each even "thumb," That is if you subtract it from "2" you now have a mark halfway from one and two, and then if you add it to "2", you have a mark half way from two and three, then repeat this for 4,6,8 and you have 10 marks as you go from the first red mark to the second red mark (with 9 of them being blue).
- Take a Picture of your scales and insert into your lab report
Part 4: Data Collection.
Using the two scales fill in the data table on your report with the identity of each object and its diameter and circumference in each scale (hand and decihand)
Hand Scale
- Take the red marker on the second string (that has no thumbs) and make a red mark every 5 thumbs (if they are taped next to each other you can simple use the first string to measure where the marks are. This is the "hand" scale, and we are saying there are five thumbs to a hand.
Decihand Scale
- Now go to the first scale (with both red and blue marks) and between each mark make another blue mark, so that there are 9 equal spaced blue marks between each red mark. So each of the blue marks is 1/10th the distance of a red mark, and this would be a decihand. Note, you can fold the piece of paper you used to determine the length of a thumb in half and use that to mark of these distances. To avoid systematic error in making your scale you may want to alternate adding or subtracting this from the existing marks. That is, after adding it to your zero mark you could add and subtract from each even "thumb," That is if you subtract it from "2" you now have a mark halfway from one and two, and then if you add it to "2", you have a mark half way from two and three, then repeat this for 4,6,8 and you have 10 marks as you go from the first red mark to the second red mark (with 9 of them being blue).
Part 5: Google Sheets.
Using Google Sheets, make two properly labeled graphs to determine Pi based on your thumb, one using your "hand" units and the other your "decihand" and upload to the Google Classroom. Although you are maintaining contact with your team members over Zoom, and you can discuss your sheets by sharing them, each student is creating a scale based on their own thumb.
The following YouTube should help you in using Google sheets for developing linear graphs.
Video \(\PageIndex{1}\): Tutorial on using Google sheets for linear graphs created by Bob Belford (https://youtu.be/muF0eJkN9CQ)
May 29, 2020
Group Graphing Assignment
Review Section 1B.5: Graphs and Graphing, and specifically go to the section on Graphing Linear Functions where there are step-by-step instructions on how to create a graph.
We now from Section 1B.5 that the equation for a linear function is \[y=mx+b \], where
m is called the slope of the line, which is the ratio of the change in y (the rise) to the change in x (the run). Since the line is linear, the slope is the same between any two points along the line.
b is called the y-intercept, which is the value of y when x=0.
If a linear function is based on an extensive property like the mass and volume of a substance, or the circumference and diameter of a circle, then the Y intercept (b) is zero (if on the scale zero means there is nothing), as if the mass of an object is zero, so is it's volume, or if the diameter of a circle is zero, then its circumference must also be zero. So the above equation becomes \[y=mx \]
Think: Should you include the point (0,0) in your graph? Why or why not?
Work in Zoom breakout groups with your teammates. As you are building the group graph try to identify any errors and think of what could be the source of that error.
- Open the Google Sheet and look at the tabs. Each student has to copy their data to one of the tabs labeled "Student 1", "Student 2", etc. This is needed to ensure that all team members have access to each other's measurements and can work together.
- Now navigate to the Hand Scale tab. Here you need to use data from all team members' Hand scale measurements to build one graph that includes the origin and one graph that doesn't. You must identify which data points are your own. That is, you can color code your data points, or use a different symbol.
- Open the next tab labeled "Decihand scale". Repeat Step 2, but this time use data from obtained with the Decihand scale.
Interactive Element
Group Graphing Assignment
Lab Report
It is time to fill out your lab report and attach the pictures that you took yesterday. Make sure you are signed in with your school email, otherwise you won't have access to the Google Form. You need to click on the link in your Google Classroom assignment to start working on your lab report.
Contributors and Attributions
Robert E. Belford (University of Arkansas Little Rock; Department of Chemistry). The breadth, depth and veracity of this work is the responsibility of Robert E. Belford, rebelford@ualr.edu. You should contact him if you have any concerns. This material has both original contributions, and content built upon prior contributions of the LibreTexts Community and other resources, including but not limited to:
- Elena Lisitsyna