
2.3: Protein Structural Determination
- Page ID
- 170152
X-ray protein crystallography is a technique by which it is possible to determine the three dimensional positions of each atom in a protein. Now over 100 years old, x-ray crystallography was first used to determine the three dimensional structures of inorganic materials, then small organic molecules, and finally macromolecules like DNA and proteins. To date, about 100,000 protein structures have been published in the Protein Data Bank, with almost 10,000 added every year. To use this technique, the crystallographer obtains protein crystals, records the diffraction pattern formed by x-rays passed through the crystals, and then interprets the data using a computer. The result is a atomic-resolution model of a protein.
Technique
Obtaining crystals
The first and least certain step in crystallography of a protein is obtaining crystals of the protein of interest. Obtaining suitable amounts of the protein of interest is usually carried out in a straightforward manner using established molecular biology techniques such as molecular cloning and affinity chromatography. However, the crystallization step remains the bottleneck for this technique, with some proteins (particularly proteins that exist in the aliphatic environment of the plasma membrane) remaining intransigent to crystallization even in the face of the most diligent crystallographers. Thus, for each protein of interest, a large number of crystallization conditions must be tried, necessitating a relatively large amount (milligrams) of the pure protein.
Protein production and purification

To produce suitable amounts of protein, contemporary crystallographers turn to molecular biology's old friend Escherichia coli. A gene which codes for the protein of interest is cloned into a small, circular piece of DNA known as an expression plasmid. The expression of the gene is typically under the control of an inducible promoter, and is regulated by the researcher rather than the bacteria. Cells are transformed with the expression plasmid, grown to high density, and induced to express the protein of interest. The cells are lysed chemically with detergents or physically with sonication, and the protein is purified, typically via affinity chromatography. High purity (greater than 95%) is desirable. Often, it takes multiple experiments before the method that obtains maximum protein is found.
Crystallization
The concentrated protein solution obtained is then subjected to a wide variety of crystallization conditions. Since we have no way of knowing a priori which set of conditions is right for obtaining crystals of a given protein, many different conditions are tried in parallel using a technique called drop diffusion.
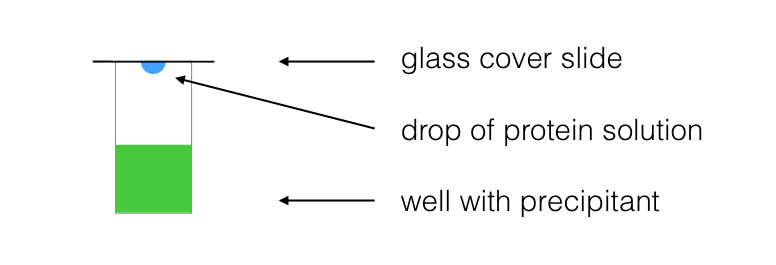
In this technique, a small quantity (typically a microliter) of concentrated protein solution is mixed with an equal volume of precipitant. This drop is separated by air from a large volume of precipitant solution. The drop is hypotonic to the precipitant and slowly equilibrates to the concentration of the large volume of precipitant. Concomitantly, the concentration of protein increases. If this process occurs at just the right rate, the protein precipitates out of solution into an ordered lattice structure: a protein crystal.
It is often said that this part of crystallography is more of an art than a science, and indeed there is little theoretical guidance available to the crystallographer who wishes to crystallize a new protein. Patience, and to some extent, luck, determine the sucess or failure of the crystallization of any particular protein.
Obtaining x-ray diffraction data
Once crystals of suitable size and composition are obtained, it is necessary to bombard the crystal with x-rays and observe the diffraction pattern. An x-ray diffractometer works in a similar manner to a light microscope. In a light microscope, the subject is irradiated with visible light (400 nm < λλ < 700 nm$), which is diffracted by a lens onto the retina, producing a macroscopic image of a microscopic object. Molecules such as proteins are much smaller than microscopic structures like cells, and, as such, require that a shorter wavelength of radiation be used during diffraction. X-rays, where $100 pm < λλ < 10,000 pm$, are the perfect size to diffract around atoms (32--225 pm), bonds (74--267 pm), and molecules (100 pm to hundreds of Angstroms). However, x-rays are difficult to focus in a manner analogous to the way a lens focuses visible light. Crystallographers employ computational methods to capture the x-ray scattering pattern (pictured at right) and infer the three-dimensional positions of atoms in a molecule.
X-ray sources
Traditionally, x-ray crystallographers filtered and directed the x-rays generated by radioactive cesium in their diffractometers, but today it is much more common to use synchrotron radiation to irradiate samples. Synchrotrons, huge hollow rings used to accelerate electrons for use in studies of subatomic particles, produce huge amounts of tunable (different wavelengths) x-ray radiation that is perfect for irradiating crystals.

Sample preparation
The crystal is suspended in aqueous solution containing a cryoprotectant in the eye of a small loop. The crystal and loop are cooled with a continuous stream of liquid nitrogen to prevent chemical damage by the x-rays. X-rays are directed through the crystal, and the diffraction pattern at any given moment is recorded by a detector. The crystal is rotated sightly and a new diffraction pattern is obtained. This process is repeated through 360 degrees along one axis (typically rotations through a smaller angle on another axis are also recorded to avoid blind spots) until the instrument has recorded a diffraction pattern for each position.
X-ray scattering
As an incident x-ray (electromagnetic wave) overlaps with an electron, it is elastically scattered, generating a secondary wave that has the same wavelength, but different direction, than the incident wave (thus the wave is "scattered" or "diffracted"). Due to the symmetry of the crystal and its many repeated units, these secondary waves interfere constructively at only one point along a circle drawn around the atom that scattered them. It is that point, described by Bragg's Law, that appears as a dark spot on the detector. An example diffraction pattern, from a SARS protease, is displayed at right.
Obtaining an electron density map
The data recorded by the detector during diffraction are now subjected to computational analysis. First, each spot in each diffraction image is indexed, integrated, merged, and scaled by a computer, producing a single text file from thousands of images. The position of each spot depends on the properties of the crystal, and as such is different for every protein. The process of converting the reciprocal space-representation of the crystal into an interpretable electron density map is known as phasing.
Shown below is the software PyMOL displaying the electron density map (white) for Protein Data Bank structure 4BLL, a peroxidase from the model organism Pleurotus ostreatus, overlayed with the model from the PDB structure (pink).
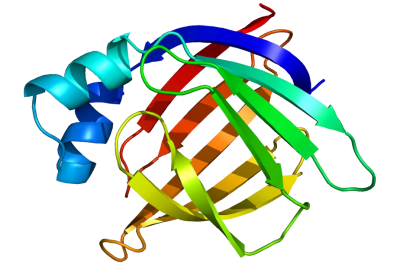
Obtaining a three-dimensional model
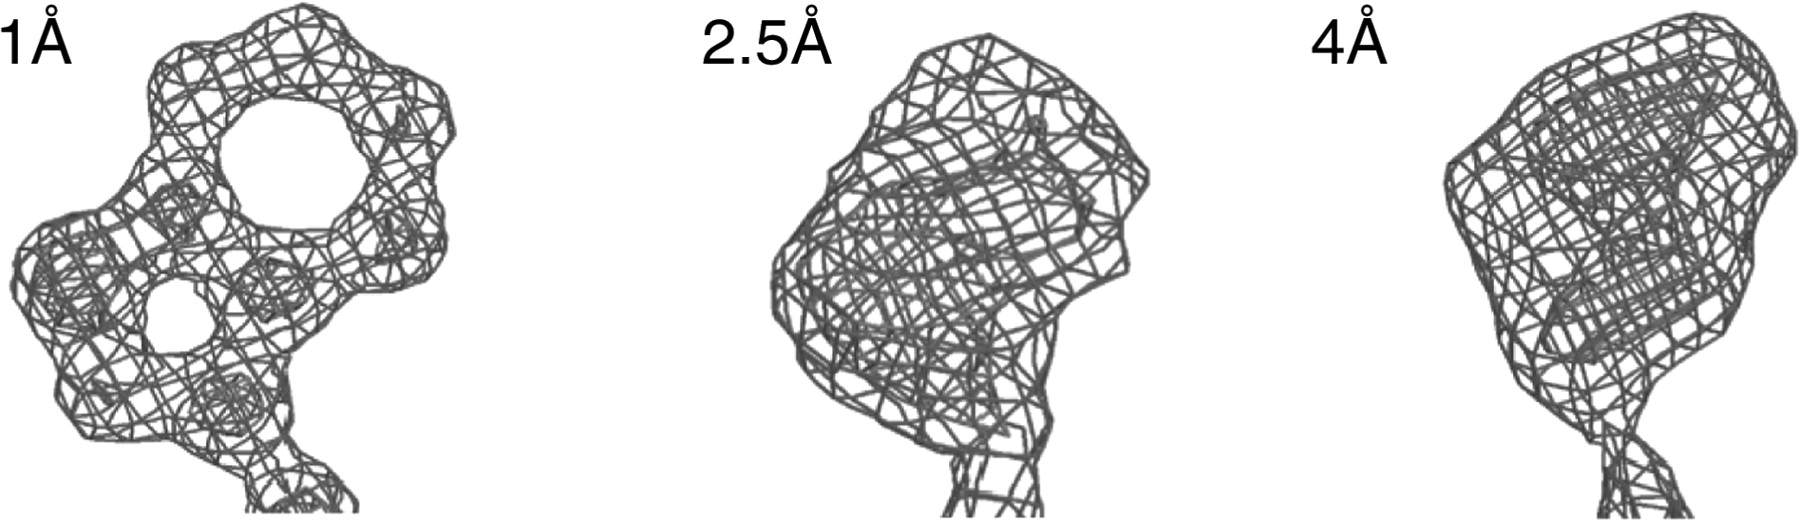
With sufficient resolution (less than 1.5 A), it is possible to automatically generate a model based on the electron density map and known bond angles and lengths, and known sizes of atoms. In practice, not all crystallography data is of such high quality. Often, the crystallographer uses molecular visualization software to manually fit a chemical model to the electron density data. The result is a model that can be viewed with molecular visualization software. An example, draw in PyMOL from PDB structure 4BLL, is below.

NMR of proteins and peptides
In this chapter you have learned enough about NMR to be able to understand how it is used to solve the structures of relatively small organic molecules. But what about really big organic molecules, like proteins?
X-ray crystallography, not NMR, is the most common way to determine the precise three-dimensional structure of a protein, and in a biochemistry class you will look at many images of protein structures derived from x-ray crystallography. While it is an immensely powerful tool for analyzing protein structure, crystallography has two major drawbacks. First, it relies on a researcher being able to get a protein to form regular, ordered crystals, which can be very challenging. Most proteins are globular, meaning they are (very roughly) spherical in shape. For a molecule to form crystals, it must pack together tightly in an ordered, repeating way: think of a neat stack of cube-shaped objects. Spheres, however, are inherently difficult to pack this way. Imagine trying to make a pile of tennis balls - they just roll apart, because so little of each ball's surface area comes into contact with its neighbor, thus there is very little friction (ie. noncovalent interactions!) holding them together. A large percentage of known proteins simply will not crystallize under any conditions that have been tried - therefore, we cannot determine their structure using x-ray crystallography.
Secondly, a lot of what is most interesting about proteins is how they move: flaps open and close when a substrate binds, or one part of the protein moves over to connect with another part. Protein action is dynamic. A crystal, on the other had, is static, or frozen. A protein structure determined by x-ray crystallography is like a still photograph of leaping dancer: we can infer from the picture what kind of movement might be taking place, but we can't get a full appreciation of the motion.
This leads to NMR, which of course is done in solution. It is easy to get most proteins into aqueous solution, so there are no worries about trying to make crystals. Also, a protein in solution is free to move, so NMR can potentially capture elements of protein dynamics. So why don't scientists always use NMR to look at proteins?
After working through a few NMR structure determination problems in this chapter, you have an appreciation for the brainwork required to figure out the structure of a small organic molecule based on its NMR structure: now imagine doing this with a protein, with its thousands of carbon and hydrogen atoms! Nevertheless, spectroscopists are gradually getting better and better at using NMR and computer-power to do just this. The advanced NMR techniques and methods of analysis are far beyond the scope of our discussion here, but you can see how useful it could be to protein scientists to be able to 'see' what a protein looks like using NMR, and if you are interested in this area of research you can learn about it in more advanced courses.
Note: The Spectral Database of Organic Compounds is a great resource for looking at NMR spectra (both proton and carbon) for a large number of compounds - the more examples you see, the better!
Contributors
-
Organic Chemistry With a Biological Emphasis by Tim Soderberg (University of Minnesota, Morris)