13 Charts Equations
- Page ID
- 361948

\( \newcommand{\vecs}[1]{\overset { \scriptstyle \rightharpoonup} {\mathbf{#1}} } \) \( \newcommand{\vecd}[1]{\overset{-\!-\!\rightharpoonup}{\vphantom{a}\smash {#1}}} \)\(\newcommand{\id}{\mathrm{id}}\) \( \newcommand{\Span}{\mathrm{span}}\) \( \newcommand{\kernel}{\mathrm{null}\,}\) \( \newcommand{\range}{\mathrm{range}\,}\) \( \newcommand{\RealPart}{\mathrm{Re}}\) \( \newcommand{\ImaginaryPart}{\mathrm{Im}}\) \( \newcommand{\Argument}{\mathrm{Arg}}\) \( \newcommand{\norm}[1]{\| #1 \|}\) \( \newcommand{\inner}[2]{\langle #1, #2 \rangle}\) \( \newcommand{\Span}{\mathrm{span}}\) \(\newcommand{\id}{\mathrm{id}}\) \( \newcommand{\Span}{\mathrm{span}}\) \( \newcommand{\kernel}{\mathrm{null}\,}\) \( \newcommand{\range}{\mathrm{range}\,}\) \( \newcommand{\RealPart}{\mathrm{Re}}\) \( \newcommand{\ImaginaryPart}{\mathrm{Im}}\) \( \newcommand{\Argument}{\mathrm{Arg}}\) \( \newcommand{\norm}[1]{\| #1 \|}\) \( \newcommand{\inner}[2]{\langle #1, #2 \rangle}\) \( \newcommand{\Span}{\mathrm{span}}\)\(\newcommand{\AA}{\unicode[.8,0]{x212B}}\)
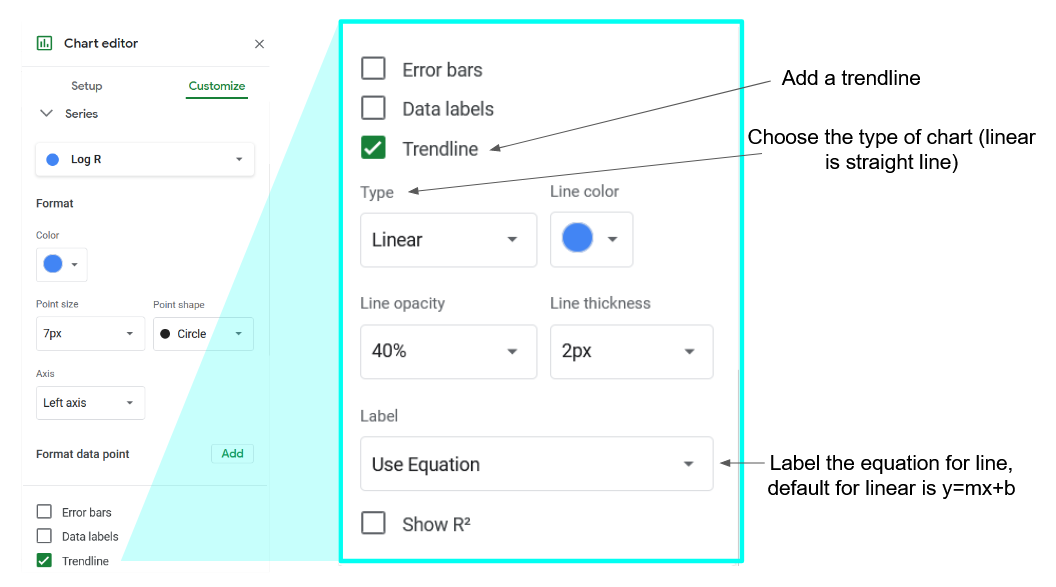
You can add a trendline to get the equation for your graph. To add a trendline go to the chart toolbar then customize and select series.
Scroll down and check off trendline. Use type to select the type of chart then go to label and select Use Equation.
| Type | Description | Equation |
|---|---|---|
| Linear | For data that closely follows a straight line. | \(y = mx+b \) |
| Exponential | For data that rises and falls proportional to its current value. | \(y = A*e^{Bx} \) |
| Polynomial | For data that varies | \( ax^{n} + bx^{(n-1)} + … + zx^{0} \) |
| Logarithmic | For data that rises or falls at a fast rate and then flattens out. | \( y = A*ln(x) + B\) |
| Power series | For data that rises or falls proportional to its current value at the same rate | \( y = A*x^{b} \) |