
1.4: The ideal gas law, functions and derivatives
- Page ID
- 347779
The ideal gas law gets taught and learned in a easily memorized way:
However, when it comes to visualizing the realities of the ideal gas law in graphical form, it's more useful to rearrange the equation. Most presentations of ideal gas behavior as a function of a variable of state make pressure the dependent variable:
Note that the left side is not merely pressure P, but is pressure as a function of the other three state variables - P(n, T, V). Because this is a function of more than one variable, it resists most of the understanding of calculus we obtain early in our mathematical education, where we only take derivatives of functions of a single variable. Taking derivatives of one variable when other variables are changing isn't often useful for explanation.
So we say this expression has no meaning:
However, let's say we're only interested in the rate of change of pressure as temperature changes, leaving number of moles constant and volume constant (we describe this as change behavior in a closed, rigid container). That does have meaning, but we need to express it in a new way, a way we haven't seen before. We describe this as a partial derivative, in this case a partial derivative of pressure with respect to temperature, with moles and volume constant. We notate this derivative like this:
Using the lower-case Greek letter ∂ is our indicator that this is a partial derivative that will focus on only one variable; the variables to be held constant (n, V) are placed in the subscript at lower right. Therefore the partial derivative is equivalent to a derivative of a single variable with all the constants factored out:
But the first derivative with respect to T of T is just 1, and this expression can be easily simplified:
This means that if moles and volume are held constant, the derivative of pressure with respect to temperature must be a constant as well.
This is not surprising!
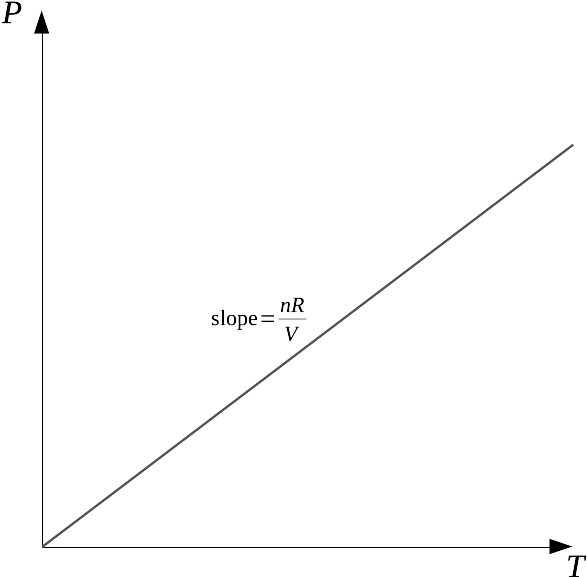
The relationship between pressure and temperature is a linear relationship, after all; we could just solve the ideal gas law for P/T and we'd get the same slope nR/V. A linear relationship between a dependent and an independent variable is a relationship where the derivative of the dependent variable doesn't change, because the slope of the graph isn't changing.
There are many relationships between the variables of state that turn out to be linear in this way. Not all of them do, however. The most important example of a nonlinear relationship between variables of state is the relationship between pressure and volume:
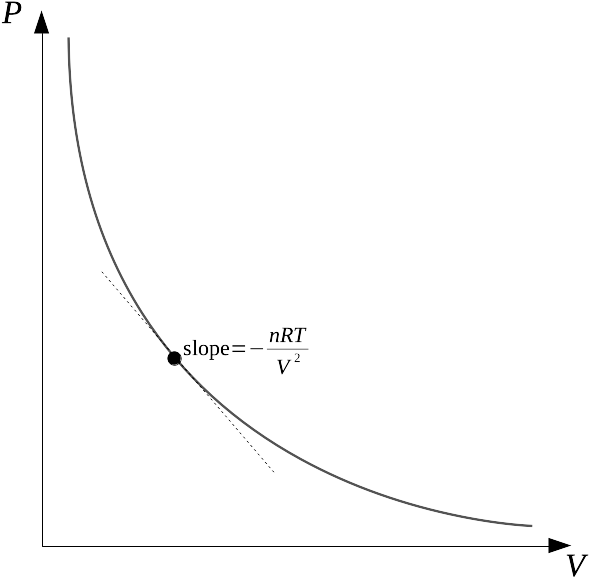
Just a quick scan of this graph indicates that this won't give us a constant slope at every position the way the pressure vs. temperature graph did. And indeed, we run into an additional application of the calculus when we go to take the derivative of a function of pressure with respect to volume, holding temperature and moles constant - the volume is in the denominator, and derivatives of negative powers of a quantity must be negative themselves:
This is a little more involved, but again it's not surprising. At every point, as pressure is increased, volume of the container decreases; the rate of change of pressure with respect to volume is negative. The rate of change is steepest at small values of V and shallowest at large values of V; that reflects the term of V2 in the denominator of the derivative. The mathematics of the derivative predicts the trend of the graph.
We take derivatives in physical chemistry with this purpose in mind. We are using these derivatives to build our explanatory power for the trends that are fundamental to the relationship between the variables of state.