
12: Bromination of Acetone
- Page ID
- 204136
Objectives
- To determine the rate law of a chemical reaction using the Method of Initial Rates.
Part A: Finding the Rate Law Using the Method of Initial Rates
The rate law of a chemical reaction is a mathematical equation that describes how the reaction rate depends upon the concentration of each reactant. Two methods are commonly used in the experimental determination of the rate law: the method of initial rates and the graphical method. In this experiment, we shall use the method of initial rates to determine the rate law of a reaction.
The reaction to be studied in this experiment is represented by the following balanced chemical equation:
\[\ce{CH_{3}COCH_{3}}( aq ) + \ce{Br_{2}}( aq ) \ce{->} \ce{BrCH_{2}COCH_{3}}( aq ) + \ce{HBr}( aq) \label{1}\]
This reaction proceeds relatively slowly. The rate law for this reaction is of the form:
\[\text{Rate} = k [\ce{Br_{2}}]^{x}[\ce{Acetone}]^{y}[\ce{H_{3}O^{+}}]^{z} \label{2}\]
where the value of the rate constant, \(k\), is dependent upon the temperature at which the reaction is run. The values of \(x\), \(y\), \(z\) and \(k\) must be found for this reaction in order to specify the rate law completely. The values of the reaction orders, \(x\), \(y\), and \(z\), are usually, though not always, small integers.
The method of initial rates allows the values of these reaction orders to be found by running the reaction multiple times under controlled conditions and measuring the rate of the reaction in each case. All variables are held constant from one run to the next, except for the concentration of one reactant. The order of that reactant concentration in the rate law can be determined by observing how the reaction rate varies as the concentration of that one reactant is varied. This method is repeated for each reactant until all the orders are determined. At that point, the rate law can be used to find the value of \(k\) for each trial. If the temperatures are the same for each trial, then the values of \(k\) should be the same too.
The rate of the reaction can be defined as the rate of decrease of the concentration of \( \ce{Br_{2}}\):
\[\text{Rate of Reaction} = - \frac{ \Delta \ce{[Br_{2}]}}{\Delta t} \label{3}\]
Note that this is actually the average rate of the reaction over the time interval \(\Delta t\) since the concentration of \( \ce{Br_{2}}\) and therefore the rate of the reaction is continuously decreasing during \(\Delta t\). In this experiment we can assume that \(\Delta \ce{[Br_{2}]}\) is negligible compared to \( [\ce{Br_{2}}]\) thus allowing us to approximate our measured average rate as being equal to the initial, instantaneous rate.
Pre Lab Video
Procedure
Safety and Waste Disposal
- Solutions must be collected and placed in the hazardous waste container.
Part I: Preparing Solutions and Observing the Reaction
Step 1
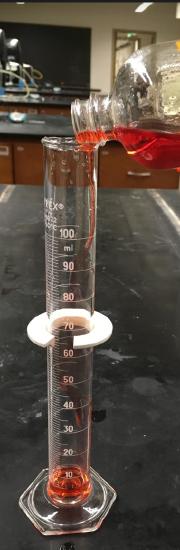 Obtain 40.0 mL of 0.02 M Br2 solution. Store it in a clean, labeled graduated cylinder. Close the top with parafilm until you need to use it.
Step 2
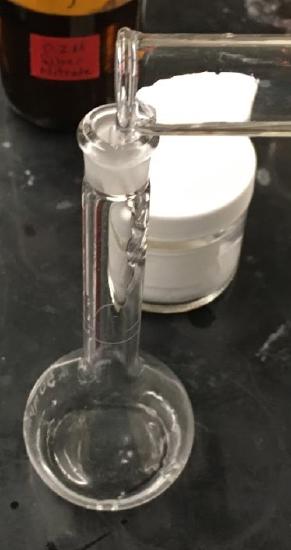 Prepare 50 mL of a 4.0 M acetone solution by measuring 15.0 mL of reagent acetone using a graduated cylinder. Place the acetone in a clean, 50 mL volumetric flask. Fill the flask half full of distilled water and mix. Finish diluting to the 50 mL mark and mix.
Step 3
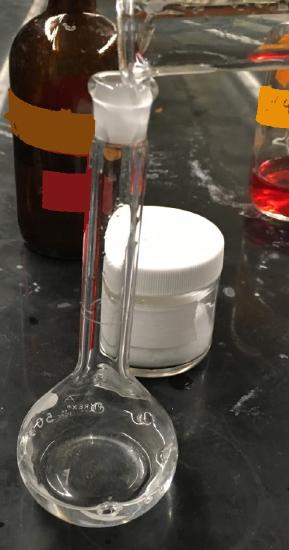 Make 50 mL of a 1.0 M HCl solution by measuring 12.5 mL of 4.0 M HCl with a graduated cylinder. Half fill a clean, rinsed 50 mL volumetric flask with distilled water. Add the measured HCI. Finish diluting to the 50 mL mark and mix.
Step 4
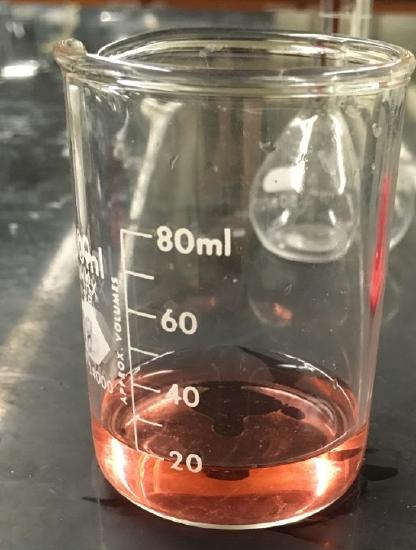
 Mix 5.0 mL of the acetone and HCl solutions with 10.0 mL of distilled water into one beaker. Add 5.0 mL of bromine solution to the mixture. Observe the mixture for approximately 5 minutes and record your observations in your notebook.
Step 5
In your lab notebook, write a statement that speculates on what caused the change you observed.
Part II: Data Collection: Absorbance vs. Time
Step 1
 Open SI 400 program on the computer.
Step 2
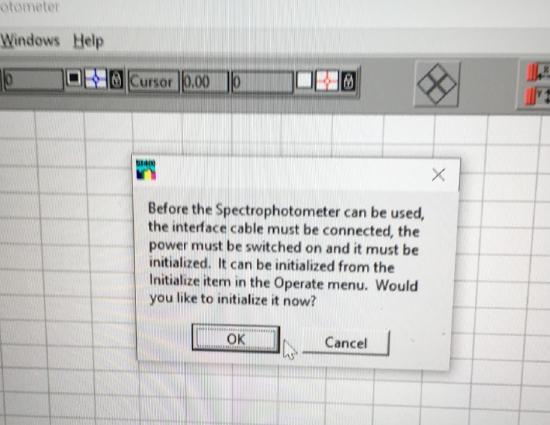 Initialize the spectrophotometer and click okay to turn on the deuterium lamp
Step 3
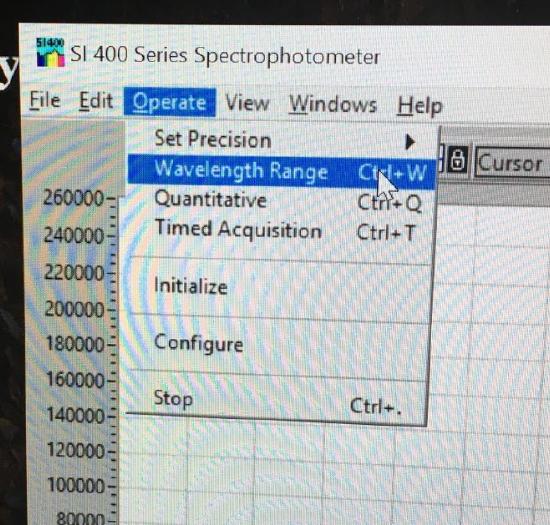
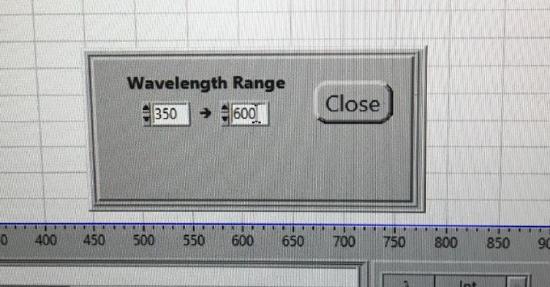 Use the drop down menu to choose Operate. In the box, select Wavelength Range. Set for 350 - 600 nm and the Crossover Wavelength to 420 nm.
Step 4
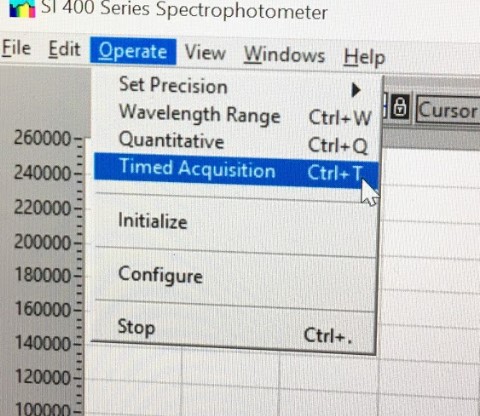
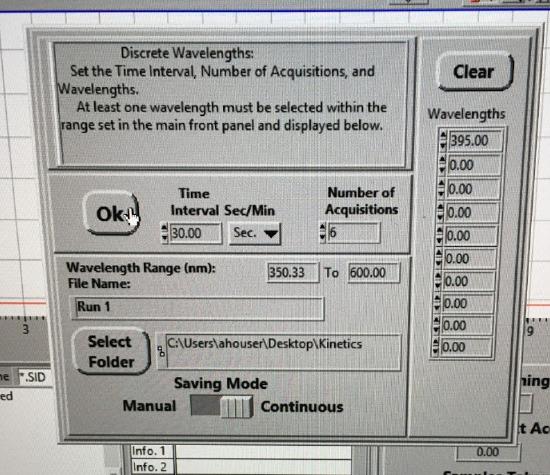 Under Operate, select Timed Acquisition to collect timed data. Select Setup. Enter data to be collected at 30 sec intervals and 6 data points. Set the wavelength collection (right column) for 395 nm. Set the data to be collected continuously. Select the kinetics folder on the desktop for transferring data. Click Select Current Directory button. Set file name to Run 1.
Step 5
Close the set up program. For each of the four trials you collect, you will need to open this set up menu and rename each trial, i.e. Run 2, 3, or 4. Select OK to close. Select Overwrite Data.
Step 6
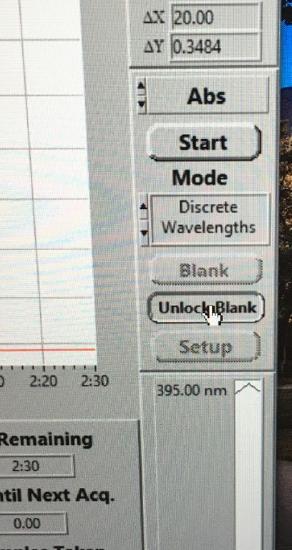
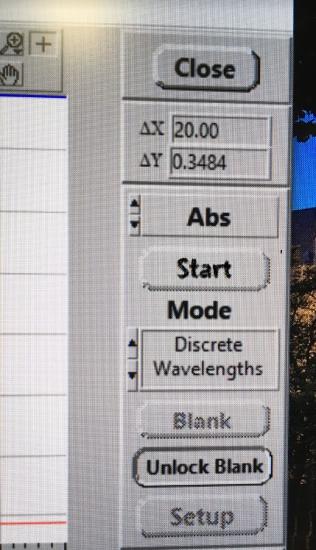
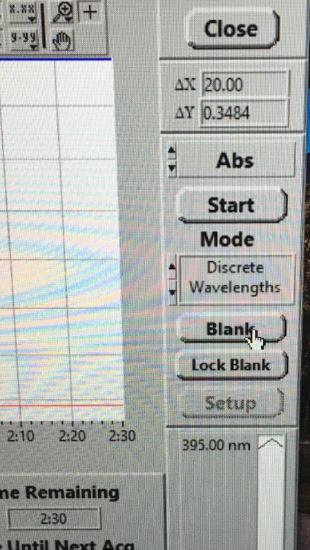 Click Unlock Blank and insert the cuvette containing water into the cell holder. Click Blank. The program will automatically lock the blank for this experiment.
Step 7
 Prepare the first solution to be analyzed using the volumes given in Table 1 by mixing the volumes of acetone, water and HCl in a small, labeled beaker using a graduated cylinder.
Step 8
Add the volume of bromine solution to a second small, labeled beaker using a graduated cylinder.
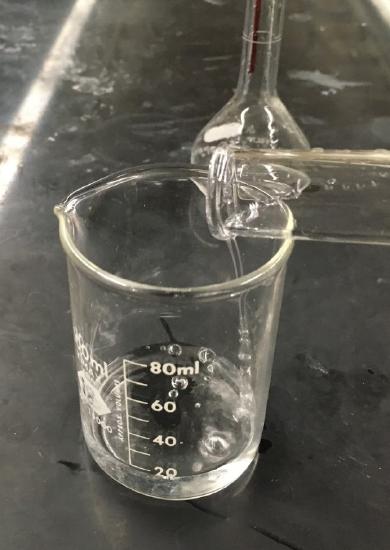
Step 9
 Using a timer, mix the two solutions by pouring the bromine into the first beaker containing acetone, water and HCl.
Step 10
Rinse the cuvette by pouring a small amount of the solution and then discarding into a waste beaker. Fill the cuvette three quarters of the way full.
Step 11
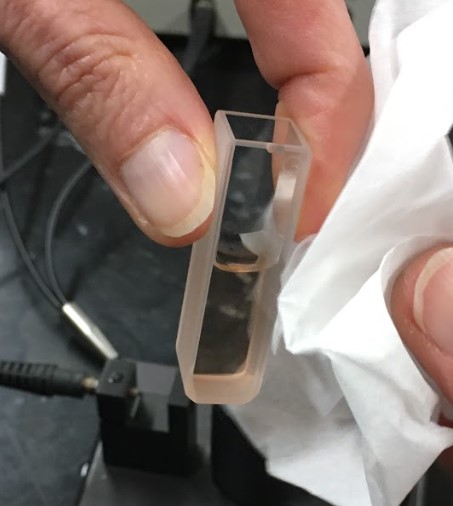
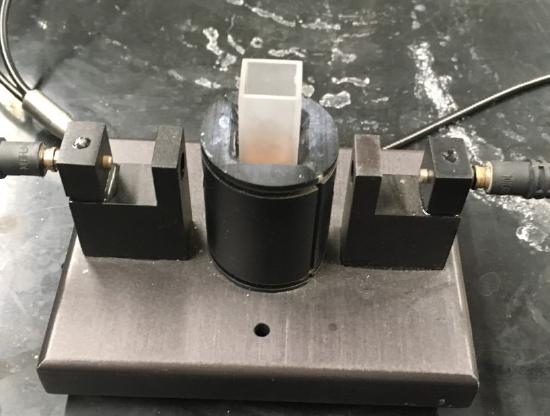 Wipe the outside of the cuvette carefully with Kimwipes and insert it into the cell holder so that the light path travels through the clear sides.
Step 12
 At exactly 45 seconds after you mixed the two solutions together, click start. The computer will now collect the absorbance every 30 seconds for 150 second total time.
Step 13
After completing the collection, save the data under Save As, an Excel file in the File menu. Name as Kinetics Exp #(1, 2, 3, or 4) appropriately. Save file to the Kinetics folder on the desktop. Minimize this window.
Step 14
Open Excel and open the file you saved. Record the data in your notebook.
Step 15
Prepare a graph of the data.
Step 16
Label it and add a linear trendline, the equation and \(R^{2}\) value.
Step 17
Discard the sample into the waste beaker.
Step 18
Repeat Steps 5 - 17 for remaining trails.
| Trial | 0.020 M \(\ce{Br_{2}}\) (mL) | 4.0 M acetone (mL) | 1 M HCl (mL) | Distilled water (mL) |
|---|---|---|---|---|
| 1 | 5.0 | 5.0 | 5.0 | 10.0 |
| 2 | 10.0 | 5.0 | 5.0 | 5.0 |
| 3 | 10.0 | 5.0 | 10.0 | 0.0 |
| 4 | 10.0 | 10.0 | 5.0 | 0.0 |
Data Analysis
Step 1
The rate of this reaction can be expressed as the rate of change for \(\ce{Br_{2}}\) with time. \(\ce-\Delta{[Br_{2}]}/\Delta t\). This expression is related to the rate of change of the absorbance of the solution and so can be rewritten as \(-\Delta Abs/\Delta t\). A plot of Abs vs. time for a first order reaction will yield a line with slope as \(-\Delta Abs/\Delta t\). The rate of each reaction is found on the Excel graph for each experiment. Print out each graph to turn in.
Step 2
Using the volumes in Table 1. Calculate the concentration of each reactant in each solution. Note that the total solution volume each time is 25.0 mL. Construct a new table for the calculated concentrations as well as a column for the rate of the reaction calculated from the slope, \(-\Delta Abs/\Delta t\).
Step 3
What can be said about the effect each of the three solutions has on the rate of the reaction? (Hint: Use combinations of experiments to prove your point and isolate the effect of each solution.)
Step 4
An equation called a rate law shows the relationship between the concentration of reactants and the rate of the reaction. The rate law for the reaction studied in this experiment has the form:
\[ Rate = - \Delta Abs/\Delta t \approx - \Delta \ce{Br_{2}}/\Delta t = k[\ce{[Br_{2}]}^{x}[acetone]^{y}[\ce{[H_{3}O^{+}]}^{z} \]
By using the data from the proper experiments, concentration dependencies can be isolated from the ratio since the data is set such as to eliminate two of the three reactants with appropriate ratio relationships.
Step 5
From your data for rate and concentrations of reactants, determine x, y, and z for this experiment by taking appropriate ratios to eliminate all but one of the reactants.
Step 6
Write the Rate Law for the bromination of acetone based on your data. In these cases, the values should be integers so if they were not you need to round them accordingly.
Step 7
Using your Rate Law determine the rate constant for the bromination of acetone from your data. Is your value of the rate constant k constant? Explain your answer. What is your overall rate law including k.
Data
| Trial | \(\ce{Br_{2}}\) Concentration (M) | Acetone Concentration (M) | HCl Concentration (M) | Rate of reaction (Slope of graph) | k |
|---|---|---|---|---|---|
| 1 | |||||
| 2 | |||||
| 3 | |||||
| 4 |
Overall Rate Expression: