6.2.1: Ligand Field Stabilisation Energy (LFSE)
- Page ID
- 206429
There is a variation on how to think about d orbital splitting diagrams that can be useful in deciding how the d electrons are configured in transition metal complexes. We can use the relative energy levels of the d orbitals in a given complex to calculate whether the overall energy would be higher or lower in a high-spin vs. a low-spin case, for example. The calculation provides us with a value that is called the ligand field stabilisation energy (LFSE). Although we have been thinking of bonding in transition metal complexes in terms of molecular orbital ideas, ligand field stabilisation energy actually has its roots in a separate approach called crystal field theory.
Origin Story: LFSE originally comes from CFT
Crystal field theory (CFT) was independently developed around 1930 by German physicist Hans Bethe and American physicist John Hasbrouck van Vleck; the two later became professors of physics at Cornell and Harvard, respectively. CFT actually pre-dates the molecular orbital approach that we have been using so far, but it reaches similar conclusions about transition metal electron configurations.
Both scientists were interested in the magnetic properties of metals and metal salts. They knew these properties were related to unpaired electrons. Compounds with unpaired electrons (paramagnetic) are attracted by magnetic fields, whereas compounds having only paired electrons (diamagnetic) are not. They were interested in the factors that influenced the d electron configuration of transition metal salts, because how the d electrons filled could result in different numbers of unpaired electrons. Those differences influenced how strongly the compounds interacted with magnetic fields.
Crystal field theory does not consider any bonding interactions in transition metal compounds. It focuses only on the repulsion between the electrons on an anion and the electrons on a metal cation. Of course, all of these electrons have negative charges. As an anion approaches a metal, the physicists reasoned, both sets of electrons would experience repulsive forces that would increase their energy level.
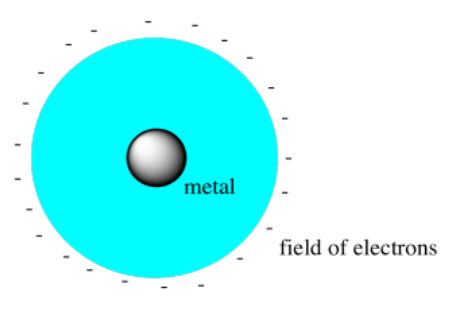
If the metal were surrounded by a spherical field of electrons (physicists like to assume things are spherical because it makes the math easier), then all of the electrons on the metal would be raised equally high in energy by these repulsive forces.

But in a metal salt, electrons are not approaching the metal from all directions. The geometry comes in because of the fact that the cations and anions pack together in specific arrays. For example, if a metal cation is sitting in an octahedral hole, electrons would only approach from six directions: at each end of the x, y, and z axes.
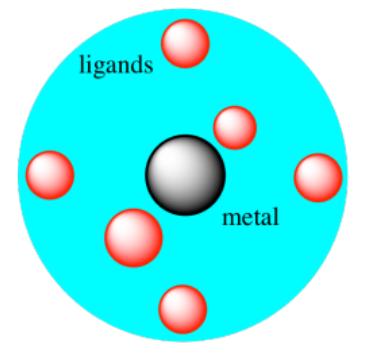
In that case, only the electrons in d orbitals that were aligned along the x, y and z axes would be raised significantly by repulsion with the approaching electrons on the anions. The electrons in the off-axis orbitals would be lower in energy than they would have been in a perfectly spherical field.

Scientists later adapted this idea to octahedral coordination complexes, in which the metal sits amidst six ligands rather than getting packed among six anions.
That result leads to a picture that is pretty similar to what we get from molecular orbital theory, at least as far as the d orbitals are concerned. In fact, the true mathematical approach to molecular orbital theory does take these electron-electron repulsions into account, but it also factors in attractions between the electrons of the ligands and the nucleus of the metal (and vice versa). The biggest difference is that molecular orbital theory includes what happens to the kinetic energy of the ligand lone pairs as they become shared with the metal (it goes down; that's a big part of why the bonds form).
The calculation of LFSE
You don't really have to appreciate where this approach came from to be able to see how it is commonly used. If we take the five d orbitals after they have been placed in an octahedral environment, we see that they are at two different energy levels. The average energy level is not, as it might first appear, halfway between these levels. That's because there are three lower energy level orbitals and two higher energy level orbitals. The average is two-fifths of the way up from the bottom three, or three-fifths of the way down from the top two.
That average energy level of the five d orbitals is called the "barycenter"; it is assigned a relative energy of zero. The difference between the top level and the bottom level is the field splitting; for an octahedral complex, this field splitting is given the symbol Δo; here, Δ stands for the energy difference and o stands for octahedral.
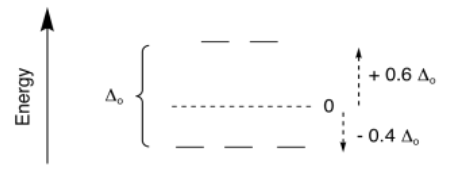
If the barycenter is at an energy level of zero, then the lower orbitals are below zero. How far? They are two-fifths of the total Δo below the barycenter. Any electrons in those orbitals are -0.4Δo below 0 in energy. Electrons in the upper orbitals are +0.6Δo above zero in energy.
Example \(d^4\):
Suppose there are four electrons. The first three electrons sit in each of the three lower orbitals, the ones we sometimes label the t2g orbitals. The fourth will either go into the upper level, which we sometimes call the eg level, or else pair up with another electron at the lower level.

We can now calculate the energy difference between these two possible cases. We can calculate what is called the ligand field stabilisation energy, LFSE (sometimes called crystal field stabilisation energy, or CFSE). It's just the sum of the energies of each of the electrons.
\[LFSE = [(0.6 \times number \: of \: e_{g} \: electrons) - (0.4 \times number \: of \: t_{2g} \: electrons)] \Delta_{o}\]
or if that's too much jargon, \(LFSE = [(0.6 \times \: \# upper \: e^{-}) - (0.4 \times \: \# lower \: e^{-})] \Delta_{o}\)
For the \(d^4\) high-spin case:
\[LFSE = [(0.6 \times 1) - (0.4 \times 3)] \Delta_{o} = [0.6-1.2] \Delta_{o} = -0.6 \Delta_{o}\]
For the \(d^4 low-spin case:
\[LFSE = [(0.6 \times 0) - (0.4 \times 4)] \Delta_{o} = -1.6 \Delta_{o}\]
So far, it certainly seems like the low-spin case is at lower energy and thus more stable. Remember, though, that low-spin configuration requires that we place two electrons together into the same orbital.

Pairing electrons in the same orbital is going to cost some energy. But how much?

This repulsion between a pair of electrons in one orbital is called the pairing energy (PE). For each pair of electrons that occupy the same orbital, that energy must be added to take that repulsion into account. As a result, a calculation of the overall stabilization energy (SE) includes both the LFSE and the PE.
\[SE = LFSE + PE\]
If there were two sets of paired electrons, we would add 2PE; if there were three sets of paired electrons, we would add 3PE, and so on.
Overall, deciding quantitatively whether a complex will be high spin or low spin is the most useful application of an LFSE calculation. However, you do have to know the values of the parameters (the field splitting and the pairing energy) for a definitive decision.
Use SE calculations to determine stabilisation in both high spin and low spin cases. Just leave your answer expressed in terms of Δo and PE.
a. Fe+2
b. Co+2
c. Co+3
d. Mn+2
e. Ti+3
- Answer a)
-
Fe+2
d6 low spin
SE = [-0.4(6)+ 0.6(0)] Δo + 3PE
= [-2.4] Δo + 3PE
d6 high spin
SE = [-0.4(4)+ 0.6(2)] Δo + 1PE
= [-.4] Δo + 1PE - Answer b)
-
Co+2
d7 low spin
SE = [-0.4(6)+ 0.6(1)] Δo + 3PE
= [-1.8] Δo + 3PE
d7 high spin
SE = [-0.4(5)+ 0.6(2)] Δo + 2PE
= [-.8] Δo + 2PE - Answer c)
-
Co+3
d6 so this looks the same as Fe+2 - Answer d)
-
Mn+2
d5 low spin
SE = [-0.4(5)+ 0.6(0)] Δo + 2PE
= [-2.0] Δo + 2PE
d5 high spin
SE = [-0.4(3)+ 0.6(2)] Δo + 0PE
= [0] Δo - Answer e)
-
Ti+3
d1 so there is no possibility of low spin or high spin
SE depends on the Magnitude of \(\Delta_o\) and total PE
Right now, let's think about Δo. How much energy is it? How big is the gap between the d orbitals? And how do we know? Well, we can easily measure this gap using a simple spectrophotometer. A spectrophotometer measures how much light is absorbed by a sample. Furthermore, it measures what specific colors of light are absorbed by the sample. As it happens, the absorption of ultraviolet and visible light by a material is associated with electrons in that material becoming promoted to a higher energy level. Shine a light on a transition metal complex, and an electron may jump the gap.
So all we have to do is shine different colors of monochromatic light on the complex and see whether it absorbs one of the colors.
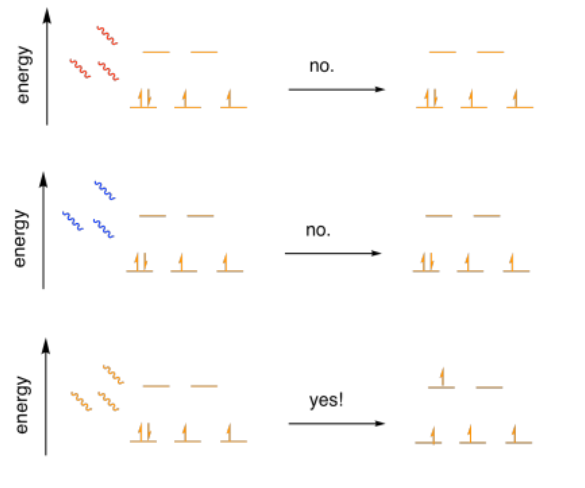
This experiment is quite reproducible. A specific compound will always absorb the same colors of light. That's why specific materials have specific colors; the color we see represents the light that is not absorbed by the material.
Different colors of light have different amounts of energy. Blue light has higher energy than orange light, which has higher energy than red light. Max Planck and Albert Einstein worked out that the energy of a photon (a "particle" or "packet" of light) is directly proportional to the frequency at which the photon oscillates or vibrates. Blue light has a higher frequency than red light, so it has higher energy.
Planck and Einstein expressed this idea with an equation,
E = hν
in which the Greek letter ν, pronounced "noo," stands for the frequency (some people just use f for frequency) and h stands for a sort of conversion factor called Planck's constant.
Blue light has too much energy to promote an electron to the next energy level in this case. It would send the electron way past the next level, and quantum mechanics does not allow that sort of thing. Red light does not have enough energy for the electron to get there. Orange light, in this case, is just right. It has exactly the right amount of energy to jump the gap.
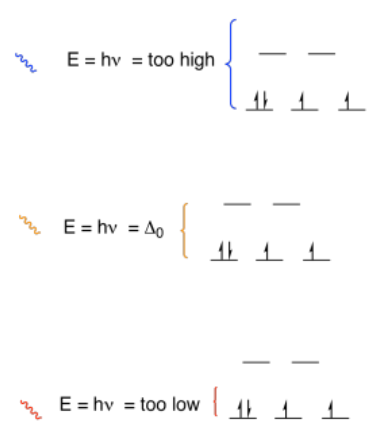
So, if we know the frequency of orange light, we know how much energy there is in an orange photon, and we know how big the field splitting is between the d orbitals.
Historically, it turns out that people have most often described visible light in terms of wavelength rather than frequencies. The wavelength is just the distance from one "peak" to the next as the wave of the photon rolls along. The higher the frequency, the closer these peaks are together, and the shorter the wavelength. Blue light has a shorter wavelength, around 400 nm, than red light, around 700 nm. A nanometer (nm) is 10-9 meters (m); a meter is around a yard.
Orange light has a wavelength of around 600 nm, or 600 x 10-9 m, or 6 x 10⁻⁷ m. For reasons we won't get into, spectroscopists in the past (people who measure the interaction of light and matter) sometimes preferred to work in centimeters, cm; there are 100 cm in 1 m, so orange light has a wavelength of 6 x 10⁻⁵ cm. Now, because they knew there was an inverse relationship between wavelength and energy (the longer the wavelength, the lower the energy; the shorter the wavelength, the higher the energy), they simply took the reciprocal of the wavelength in centimeters to get a number in cm-1, which they called wavenumbers. They used this as a unit of energy. An orange photon has an energy of 1/0.00006 cm = 16,000 cm-1.
So the gap, the field splitting, Δo in this complex is 16,000 cm-1.
Let's go back to our comparison between the high-spin and low-spin case. For high spin:
\[LFSE = [(0.6 \times 1) - (0.4 \times 3)] \Delta_{o} = [0.6 -1.2] \Delta_{o} = -0.6 \Delta_{o} = -0.6 \times 16000 cm^{-1} = -9600 cm^{-1}\]
For the low-spin case:
\[LFSE = [(0.6 \times 0) -(0.4 \times 4)] \Delta_{o} = -1.6 \Delta_{o} = -1.6 \times 16000 cm^{-1} = -25600 cm^{-1}\]
These LFSE calculations show that the low-spin case is lower in energy, by 14,000 cm-1. However, we still need to include the pairing energy. Like the field splitting, the pairing energy varies from one complex to another. 20,000 cm-1 is a ballpark estimate of a typical pairing energy.
If we use this average value for PE in the example we were discussing above for the high-spin case:
\[SE = LFSE + PE = -9600 + 0 cm^{-1} = -9600 cm^{-1}\]
For the low-spin case:
\[SE = LFSE + PE = -25600 + 20000 cm^{-1} = -5600 cm^{-1}\]
Taking the pairing energy into account in this case suggests that the high-spin case is favored. It cost less energy to jump the gap and put an electron in a high-lying eg orbital than it did to pair electrons in a low-lying t2g orbital.
Reminder: Factors that influence \(\Delta_o\)
Let's take a look at some real examples of field splitting values to get an idea of how large they are, and what factors they depend on.
The metal influences \(\Delta_o\)
For example, we can look at the charge on the metal ion:
| Table of Field Splitting Values, Δo, in Hexaquo Complexes of Differing Chargesa | ||||||
| Metal Complex | [Mn(OH2)6]2+ | [Mn(OH2)6]3+ | [Fe(OH2)6]2+ | [Fe(OH2)6]3+ | [Co(OH2)6]2+ | [Co(OH2)6]3+ |
| Δo (cm-1) | 7,800 | 21,100 | 10,400 | 13,800 | 9,300 | 18,300 |
| a) Holleman, A. F.; Wiberg, E.; Wiberg, N. Inorganic Chemistry, 34th Ed. Academic Press: Berlin, 2001. | ||||||
In this case, it looks like increased charge on the metal ion results in an increased field splitting. The same thing happens in all three examples: manganese, iron, and cobalt. As the metal ion becomes more charged, attraction of the d electrons toward the nucleus increases. The lower-lying t2g level is more strongly attracted to the nucleus because it is a little closer; consequently, it drops a little further than the eg level, and the gap gets bigger.
Charge on the metal ion is one of two key factors that influences the size of the field splitting. The other factor is the period or row in the periodic table.
| Table of Field Splitting Values, Δo, in Hexammine Complexes of Group 9a,b | |||
| Metal Complex | [Co(NH3)6]3+ | [Rh(NH3)6]3+ | [Ir(NH3)6]3+ |
| Δo (cm-1) | 21,500 | 33,100 | 41,100 |
| a) Holleman, A. F.; Wiberg, E.; Wiberg, N. Inorganic Chemistry, 34th Ed. Academic Press: Berlin, 2001. b) Miessler, G. L.; Tarr, D. A. Inorganic Chemistry, 4th Ed. Pearson, 2010. | |||
Moving from one row to the next in group 9 of the periodic table, we see that the field splitting increases by about 10,000 cm-1 each row.
In general:
- Δo increases with charge on the metal
- Δo increases with the period in the periodic table
The ligand identity influences \(\Delta_o\)
The metal ion is not the only factor that affects the field splitting. The ligands also play an important role, as seen in the table below.
| Table of Field Splitting Values, Δo, in Assorted Complexesa | |||||||
| Metal Complex | [CrCl6]3- | [CrF6]3- | [Fe(OH2)6]2+ | [Fe(CN)6]4- | [Co(OH2)6]3+ | [Co(NH3)6]3+ | [Co(CN)6]3- |
| Δo (cm-1) | 13,300 | 15,300 | 10,400 | 33,200 | 18,300 | 23,000 | 33,700 |
| a) Holleman, A. F.; Wiberg, E.; Wiberg, N. Inorganic Chemistry, 34th Ed. Academic Press: Berlin, 2001. | |||||||
If we sort these ligands into three broad categories, we can form a trend for these effects. It may be easiest to start with the three entries on the right, involving cobalt. The oxygen donor in water has two lone pairs, whereas the nitrogen donor in ammonia has only one. The extra lone pair allows water to act as a π (pi) donor; the lone pair can donate to an orbital on the metal to form a pi bond. In this case, it looks like the π donor (water) results in a smaller Δo than the normal σ (sigma) donor (ammonia).
The cyanide ligand has a donor atom that is also participating in a π bond within the ligand; there is a triple bond between the C and N of the cyanide. That means there is also an associated antibonding orbital, π*. That antibonding orbital raises the possibility of back-bonding from the metal. The metal can donate into the π* orbital to make a pi bond. Cyanide is a π-acceptor. Its field splitting is much larger than the sigma donor.
Those conclusions can be confirmed by looking at the entries for iron in the middle of the table. Cyanide is a π-acceptor whereas water is a π-donor. The field splitting in the aquo complex should be much smaller than the field splitting in the cyano complex, and it is.
The two entries for chromium on the left both show halides, which are π-donors. They illustrate a factor that can be used to predict field strength between two ligands from the same group, such as two π-donors or two π-acceptors. In general, the more basic the ligand, the greater the field splitting. Fluoride ion is more basic than chloride ion (because chloride is a more stable anion than fluoride) so it results in a slightly greater value of Δo.
The Pairing Energy
In order to thoroughly estimate the stabilisation energy, we also need reliable values for the pairing energy. Pairing energies can be calculated for free metal ions; correction factors can be applied to arrive at a corresponding value in a complex. In general, the values in coordination complexes are somewhat lower than the values in free metal ions. In the table below, we have made a general estimate that the value in the complex is about 20% lower than in the free metal ion.
| Table of Pairing Energies, PE, in Free Ions, with Estimated PE in Complexes | ||||||
| Metal Ion | Mn2+ | Mn3+ | Fe2+ | Fe3+ | Co3+ | Ru3+ |
| PE, free ion (cm-1) | 28,000 | 25,500 | 17,700 | 30,100 | 21,100 | ~15,000b |
| PE, complex (est., cm-1) | 20,400 | 22,900 | 14,200 | 24,100 | 16,900 | ~12,000b |
| a) Holleman, A. F.; Wiberg, E.; Wiberg, N. Inorganic Chemistry, 34th Ed. Academic Press: Berlin, 2001. b) Estimate. | ||||||
If we compare the pairing energies (PE) of the 2+ ions to those of the 3+ ions, we see that PE is always lower in the more highly charged ion. That's the opposite of the trend in Δo. Pairing energy is largely dependent on the size of the ion. The smaller the ion, the smaller the orbital, and the more repulsion between two electrons in the same orbital. Because a Mn3+ ion is smaller than a Mn2+ ion (Coulomb's Law says there is greater attraction for the electrons in the former case, so the ion shrinks), a pair of electrons on Mn3+ is closer together than a pair of electrons on Mn2+.
In general, pairing energies also get smaller upon moving down a column in the periodic table. Second row transition metals are larger than first-row transition metals, so the pairing energy is smaller in the second row than in the first. Third row transition metals are about the same size as first row metals, so their pairing energies are similar to those of the second row. That's because of a phenomenon called "the lanthanide contraction": third row transition metals contain an extra set of protons in their nuclei because of the f block elements before them; consequently they are a little smaller than might be expected.
Compare pairing energies to field splitting values to determine whether the following complexes would be high-spin or low spin.
a) Mn(OH2)62+ b) Fe(CN)64- c) Co(NH3)63+
- Answer a)
-
Δo < PE, so high-spin.
- Answer b)
-
Δo > PE, so low-spin.
- Answer c)
-
Δo > PE, so low-spin.
Attribution
Chris P Schaller, Ph.D., (College of Saint Benedict / Saint John's University)
Curated or created by Kathryn Haas

