
10.2: Fluorescence and Phosphorescence Instrumentation
- Page ID
- 220476
The components of instruments designed for fluorescence spectroscopy use many of the same components found in instruments for absorbaance spectroscopy in the UV -Vis.
Figure 10.2.1 shows a typical configuration for a filter based fluorometer or a monochromotor based spectrofluorometer.
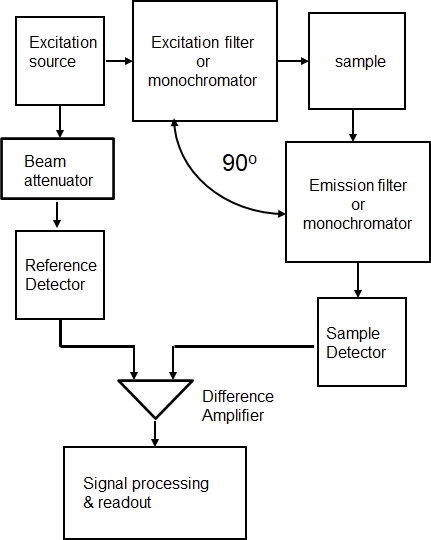
Figure \(\PageIndex{1}\): Components of a fluorometer or spectroflorometer.
A fluorometer is a filter based, fixed wavelength, instrument suitable for established quantitative fluorescence methods. A spectrofluorometer is equipped with two scanning monochromoators permitting variation in excitation wavelength, the emission wavelength or both (constant energy difference mode). The selectivity offered by spectrofluorometers is important to investigators, especially physical chemists, concerned with the spectral and structural characterization of molecules. When operated in the emission mode, with the excitation wavelength fixed and the emission wavelengths scanned, the intensity of the light emitted offers a map of the vibrational energy levels (and rotational levels for gas phase samples) of the ground electronic state. When operated in the excitation mode, with the emission wavelength fixed and the excitation wavelengths scanned and with suitable corrections for variations in the excitation intensity, the intensity of the light emitted offers a map of the vibrational energy levels (and again rotational energy levels for gas phase samples) of the excited state and a spectrum that closely resembles an absorption spectrum.
The optical layout of a Horiba Scientific FluorMax 4 spectropfluorometer is shown below in Figure 10.2.2
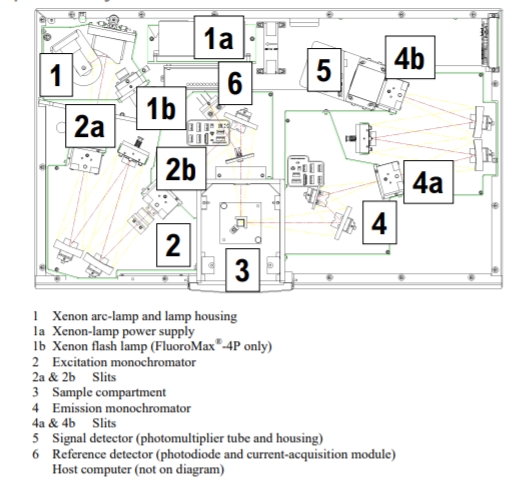
Figure \(\PageIndex{2}\): The optical layout of a FluoroMax 4 spectrofluorometer. This image was taken from the FluorMax 4 installation manual (https://www.horiba.com/fileadmin/upl...Manual_USB.pdf)
Specific components
Sources
In most applications optical sources with larger output intensities greater than a tungsten halogen lamp or a deuterium lamp are required (See Equation
10.1.7).
The most common source for simple fluorometers is the low pressure mercury lamp which produce line emission at 254 , 302, 313, 546, 578, 691, and 773 nm. Individual lines from a mercury lamp can be isolated with an interference. More recently LED's with wavelengths reaching into the UV have become useful. LEDs with narrow band emission (+/- 15 nm) are available at 365, 385, 395 or 405 as well as numerous wavelengths into the visible and near IR.
The most common source spectrofluorometers is the high pressure xenon arc lamp. Available in sizes ranging from 75 to 450 Watt, the high pressure xenon arc lamp produces near blackbody radiation covering a range from 300 nm to 1300 nm.
Wavelength Selectors
Interference filters are the most commonly used filter to select the excitation wavelength and both interference and short wavelenght cut-off (or long pass) filters are commonly used to select the emission light. Most sprectrofluorometers are equipped with two grating based monochromoators.
Transducers
Typical fluorescence signals are of low light intensities and consequently the most common transducers used are large gain photomultiplier tubes (PMTs). Often the PMTs are operated in photon-counting mode to gain an improvement in signal-to-noise. Cooling of the transducer is sometimes used to improve the signal-to-noise. Diode array and CCD transducers are sometimes used in spectrofluorometers, especially in small hand held instruments and in detectors for liquid chromatography and capillary electrophoresis.
Cells
Both cylindrical and rectangular cells fabricated from glass, fused silica or plastic are employed for fluorescence measurement. Rectangular cells need to have four polished sides. Care should be taken in the grade of optical materials and in the design of the cell compartment to reduce the amount of scattered light. Even more than in absorbance measurements, it is important to avoid fingerprints on cells because skin oils often fluorescence
Instrument Standardization and Calibration
Because of variations in source intensity, transducer sensitivity, and other instrument variables, it is impossible to obtain with a given fluorometer or spectrofluorometer exactly the same reading for a solution or set of solutions from day to day. For this reason it is common practice to standardize an instrument and set it to a reproducible sensitivity level. Standardization is often carried out with a standard solution of a stable fluorophore. The most common standard reagent is quinine sulfate having a concentration of about 10-5 M. Quinine sulfate can be excited at 350 nm and it emits strongly at 450 nm.
Quinine sulfate in 0.1 M acid solution is also a commonly used standard for quantum yield measurements. In these measurements, the integrated fluorescence is recorded for a series of quinine sulfate solutions (excitation 350 nm, emission 400 - 650 nm) with absorbances less than 0.03 a.u.. A similar set of measurements is made for a fluorophore with unknown quantum yield. The integrated fluorescence is plotted versus the solution absorbance for both quinine sulfate and the unknown and the slope of the best fit lines are calculated. The quantum yield of the unknown is then the product of the established quantum yield for quinine sulfate (0.54) and the ratio of the slopes (unknown / quinine sulfate ).
Calibration of the wavelength scales for the monochromators in a spectrofluorometer is done using cell containing clean water. The calibration of the excitation wavelength scale is based on the scattered light coming from the xenon arc lamp. In the excitation mode, with the emission monochromator set to 350 nm (1 nm slit width) the scattered light is recorded by scanning the excitation wavelength from 200 to 600 nm (1 nm slit width). The strongest sharp spectral feature should be observed at 467 nm or adjusted to be so. The calibration of the emission monochromator is based on the Raman spectrum of water. In the emission mode, with the excitation monochromator set to 350 nm (5 nm slit width), the Raman spectrum of water is recorded by scanning the emission monochromator from 365 to 450 nm (5 nm slit width). The single peak observed should be centered at 397 nm or adjusted to be so.