
11.6: Monitoring Hydrogenation and Dehydrogenation Reactions by UV Spectroscopy
- Page ID
- 242308

In order to study any enzyme-catalyzed reaction, a researcher must have available some sort of test, or assay, in order to observe and measure the reaction's progress and measure its rate. In many cases, an assay simply involves running the reaction for a specified length of time, then isolating and quantifying the product using a separation technique such as high performance liquid chromatography (HPLC) or gas chromatography (GC). This type of assay can be extremely time-consuming, however, so it is to the researcher's great advantage if a more convenient assay can be found.
Redox reactions in which a nicotinamide coenzyme participates as a hydride donor or acceptor are generally quite convenient to assay. In fact, the progress of these reactions can usually be observed in real time, meaning that the researcher doesn't need to stop the reaction in order to see how far it has progressed. \(NADPH\) and \(NADH\) have distinctive \(n-\pi\)* UV absorbance bands centered at 340 nm, with a molar absorptivity of 6290 M-1 cm-1 (section 4.4). The oxidized coenzymes \(NADP^+\) and \(NAD^+\) do not absorb at this wavelength.
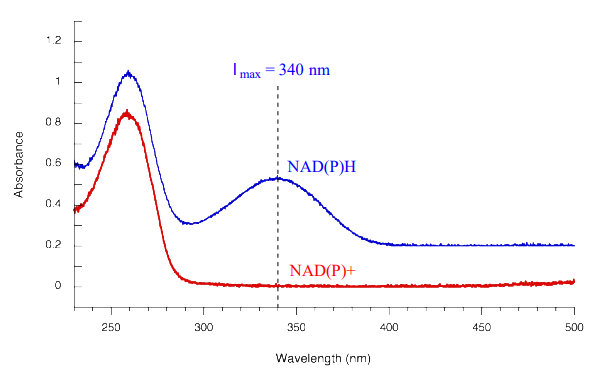
Therefore, the course of a hydrogenation reaction, in which \(NAD(P)H\) is converted to \(NAD(P)^+\), can be observed in real time if it is run in a quartz cuvette in a UV spectrometer. By observing the decrease in absorbance at 340 nm, the researcher can calculate how much \(NAD(P)H\) has been oxidized to \(NAD(P)^+\) at any given time point, and this number is the molar equivalent of the amount of organic substrate that has been reduced:
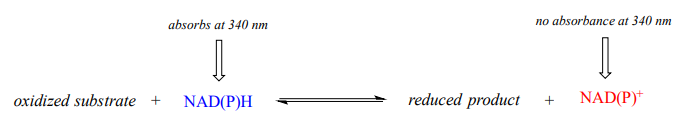
Likewise, a \(NAD^+\)-dependent dehydrogenase reaction can be followed in real time by monitoring the increase in absorbance at 340 nm as \(NAD^+\) is converted to \(NADH\).
You are observing the progress of the (R)-glycerol phosphate dehydrogenase reaction shown in the figure below.
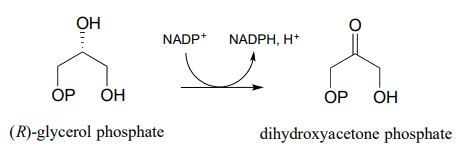
You run the reaction in a quartz cuvette (path length 1 cm) in a total solution volume of 1 mL. start with 200 mM substrate and 100 mM \(NADP^+\) in solution, zero the UV spectrophotometer, then add the enzyme to start the reaction. After 5 minutes, the A340 reading has climbed from 0.000 to 0.096. At this time point:
- How many moles of substrate have been oxidized?
- What is the solution concentration of \(NADP^+\)?
- The enzyme has a mass of 25 kilodaltons (25,000 g/mol).You added 5 mL of a 2 ng/mL solution of pure enzyme to start the reaction. How many reactions does each enzyme molecule catalyze, on average, per second? (This number is referred to by biochemists as the 'turnover number').