
11.11: Why It Matters- Inference for Means
- Page ID
- 251433
\( \newcommand{\vecs}[1]{\overset { \scriptstyle \rightharpoonup} {\mathbf{#1}} } \) \( \newcommand{\vecd}[1]{\overset{-\!-\!\rightharpoonup}{\vphantom{a}\smash {#1}}} \)\(\newcommand{\id}{\mathrm{id}}\) \( \newcommand{\Span}{\mathrm{span}}\) \( \newcommand{\kernel}{\mathrm{null}\,}\) \( \newcommand{\range}{\mathrm{range}\,}\) \( \newcommand{\RealPart}{\mathrm{Re}}\) \( \newcommand{\ImaginaryPart}{\mathrm{Im}}\) \( \newcommand{\Argument}{\mathrm{Arg}}\) \( \newcommand{\norm}[1]{\| #1 \|}\) \( \newcommand{\inner}[2]{\langle #1, #2 \rangle}\) \( \newcommand{\Span}{\mathrm{span}}\) \(\newcommand{\id}{\mathrm{id}}\) \( \newcommand{\Span}{\mathrm{span}}\) \( \newcommand{\kernel}{\mathrm{null}\,}\) \( \newcommand{\range}{\mathrm{range}\,}\) \( \newcommand{\RealPart}{\mathrm{Re}}\) \( \newcommand{\ImaginaryPart}{\mathrm{Im}}\) \( \newcommand{\Argument}{\mathrm{Arg}}\) \( \newcommand{\norm}[1]{\| #1 \|}\) \( \newcommand{\inner}[2]{\langle #1, #2 \rangle}\) \( \newcommand{\Span}{\mathrm{span}}\)\(\newcommand{\AA}{\unicode[.8,0]{x212B}}\)
Learning Objectives
- Recognize when to use a hypothesis test or a confidence interval to draw a conclusion about a population mean.
In Inference for Means, we learn to make inferences about population means. Here are the types of research questions we focus on. Notice that we are working with quantitative variables for the first time in our inference work.
| Type of Question | Examples | Variable Type | Unit |
|---|---|---|---|
| Make an estimate about the population | What proportion of all U.S. adults support the death penalty? | Categorical variable | Inference for One Proportion |
| What is the average number of hours that community college students work each week? | Quantitative variable | Inference for Means | |
| Test a claim about the population | Do the majority of community college students qualify for federal student loans? | Categorical variable | Inference for One Proportion |
| Has the average birth weight in a town decreased from 3,500 grams? | Quantitative variable | Inference for Means | |
| Compare two populations | Are teenage girls more likely to suffer from depression than teenage boys? | Categorical variable | Inference for Two Proportions |
| In community colleges do female students have a higher average GPA than male students? | Quantitative variable | Inference for Means |
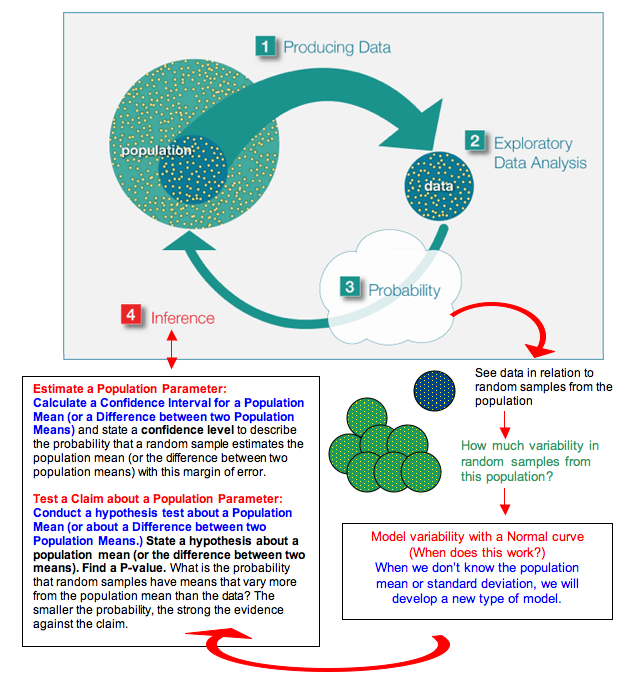
Here again is the Big Picture. We have highlighted ideas new to this module in purple.
Learn By Doing
CC licensed content, Shared previously
- Concepts in Statistics. Provided by: Open Learning Initiative. Located at: http://oli.cmu.edu. License: CC BY: Attribution