
9.10: Why It Matters- Inference for One Proportion
- Page ID
- 251395
\( \newcommand{\vecs}[1]{\overset { \scriptstyle \rightharpoonup} {\mathbf{#1}} } \) \( \newcommand{\vecd}[1]{\overset{-\!-\!\rightharpoonup}{\vphantom{a}\smash {#1}}} \)\(\newcommand{\id}{\mathrm{id}}\) \( \newcommand{\Span}{\mathrm{span}}\) \( \newcommand{\kernel}{\mathrm{null}\,}\) \( \newcommand{\range}{\mathrm{range}\,}\) \( \newcommand{\RealPart}{\mathrm{Re}}\) \( \newcommand{\ImaginaryPart}{\mathrm{Im}}\) \( \newcommand{\Argument}{\mathrm{Arg}}\) \( \newcommand{\norm}[1]{\| #1 \|}\) \( \newcommand{\inner}[2]{\langle #1, #2 \rangle}\) \( \newcommand{\Span}{\mathrm{span}}\) \(\newcommand{\id}{\mathrm{id}}\) \( \newcommand{\Span}{\mathrm{span}}\) \( \newcommand{\kernel}{\mathrm{null}\,}\) \( \newcommand{\range}{\mathrm{range}\,}\) \( \newcommand{\RealPart}{\mathrm{Re}}\) \( \newcommand{\ImaginaryPart}{\mathrm{Im}}\) \( \newcommand{\Argument}{\mathrm{Arg}}\) \( \newcommand{\norm}[1]{\| #1 \|}\) \( \newcommand{\inner}[2]{\langle #1, #2 \rangle}\) \( \newcommand{\Span}{\mathrm{span}}\)\(\newcommand{\AA}{\unicode[.8,0]{x212B}}\)
Learning Objectives
- Recognize situations that call for testing a claim about a population proportion or estimating a population proportion.
In Inference for One Proportion, we focus on making inferences about population proportions. The types of research questions we focus on in this module are bolded in the text below. Notice that we are working with categorical variables again.
| Type of Question | Examples | Variable Type | Unit |
|---|---|---|---|
| Make an estimate about the population | What proportion of all U.S. adults support the death penalty? | Categorical variable | Inference for One Proportion |
| What is the average number of hours that community college students work each week? | Quantitative variable | Inference for Means | |
| Test a claim about the population | Do the majority of community college students qualify for federal student loans? | Categorical variable | Inference for One Proportion |
| Has the average birth weight in a town decreased from 3,500 grams? | Quantitative variable | Inference for Means | |
| Compare two populations | Are teenage girls more likely to suffer from depression than teenage boys? | Categorical variable | Inference for Two Proportions |
| In community colleges do female students have a higher average GPA than male students? | Quantitative variable | Inference for Means |
We will build on what we learned in in the previous module with two additions.
- We use more formal vocabulary and notation for hypothesis testing.
- We will not know the population proportion, so we make some minor adjustments to the model of the sampling distribution that we developed in Linking Probability to Statistical Inference. The adjustments affect how we calculate the standard error.
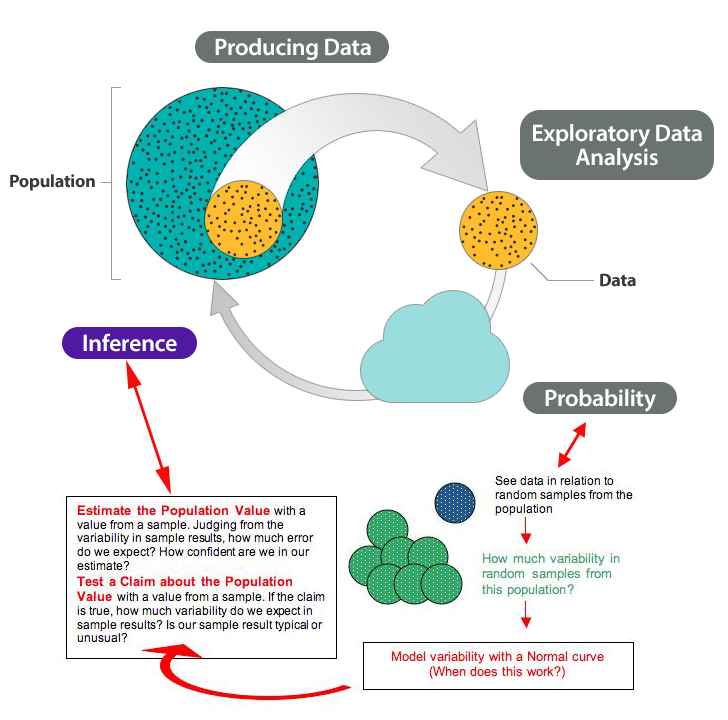
Here again is the Big Picture. We highlighted ideas new to Inference for One Proportion in purple.
Learn By Doing
CC licensed content, Shared previously
- Concepts in Statistics. Provided by: Open Learning Initiative. Located at: http://oli.cmu.edu. License: CC BY: Attribution