
4.4: Supply
- Page ID
- 250493
Supply
When economists talk about supply , they mean the amount of some good or service a producer is willing to supply at each price. Price is what the producer receives for selling one unit of a good or service. A rise in price almost always leads to an increase in the quantity supplied of that good or service, while a fall in price will decrease the quantity supplied. When the price of gasoline rises, for example, it encourages profit-seeking firms to take several actions: expand exploration for oil reserves; drill for more oil; invest in more pipelines and oil tankers to bring the oil to plants where it can be refined into gasoline; build new oil refineries; purchase additional pipelines and trucks to ship the gasoline to gas stations; and open more gas stations or keep existing gas stations open longer hours.
Economists call this positive relationship between price and quantity supplied — that a higher price leads to a higher quantity supplied and a lower price leads to a lower quantity supplied — the law of supply . The law of supply assumes that all other variables that affect supply (supply shifters) are held constant.
Supply is the relationship between the quantity supplied and the price of the good when all other influences on selling plans remain the same. A supply curve is a relationship between two, and only two, variables: quantity supplied on the horizontal axis and price on the vertical axis.
In economic terminology, supply is not the same as quantity supplied . When economists refer to supply, they mean the relationship between a range of prices and the quantities supplied at those prices, a relationship that can be illustrated with a supply curve or a supply schedule. When economists refer to quantity supplied, they mean only a certain point on the supply curve, or one quantity on the supply schedule. In short, supply refers to the curve and quantity supplied refers to the (specific) point on the curve.
Supply for Gasoline
Figure 2.3 illustrates the law of supply, again using the market for gasoline as an example. Like demand, supply can be illustrated using a table or a graph. A supply schedule is a table, like Table 2.2, that shows the quantity supplied at a range of different prices. Again, price is measured in dollars per gallon of gasoline and quantity demanded is measured in millions of gallons.
A supply curve is a graphic illustration of the relationship between price, shown on the vertical axis, and quantity, shown on the horizontal axis. The supply schedule and the supply curve are just two different ways of showing the same information. Notice that the horizontal and vertical axes on the graph for the supply curve are the same as for the demand curve. (4)
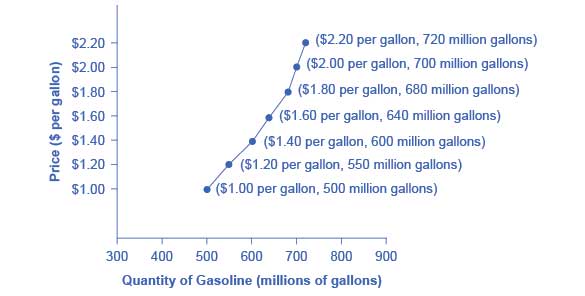
The supply schedule is the table that shows quantity supplied of gasoline at each price. As price rises, quantity supplied also increases, and vice versa. The supply curve (S) is created by graphing the points from the supply schedule and then connecting them. The upward slope of the supply curve illustrates the law of supply—that a higher price leads to a higher quantity supplied, and vice versa. (4)
Table 2.2 Price and Supply of Gasoline
| Price (Per Gallon) | Quantity Supplied (millions of gallons) |
|---|---|
| $1.00 | 500 |
| $1.20 | 550 |
| $1.40 | 600 |
| $1.60 | 640 |
| $1.80 | 680 |
| $2.00 | 700 |
| $2.20 | 720 |
Supply and Law of Supply
According to the law of supply, other things equal, as the price of a good rises , the quantity supplied rises . Therefore, the supply curve slopes upward due to the positive relationship between P and Q S . The shape of supply curves will vary somewhat according to the product: steeper, flatter, straighter, or curved.
Nearly all supply curves, however, share a basic similarity: they slope up from left to right and illustrate the law of supply: as the price rises, say, from $1.00 per bottle to $2 per bottle, the quantity supplied increases from 30 bottles to 60 bottles. Conversely, as the price falls, the quantity supplied decreases.
Whenever only price changes , and all other factors that influence supply remain the same, we move along the supply curve, as the new price is matched to its corresponding quantity demanded. Why does the law of supply hold? The law of supply holds for two main reasons:
- First, a higher price brings a larger profit and a greater incentive for producers to produce more. Profit = Total Revenue − Total Cost. Profit is negatively related to Total Cost, and positively related to Total Revenue = P*Q sold . A larger price creates incentives for producers and sellers to produce more to obtain a higher profit.
- Second, as more units of a good are produced (Qs increases), the opportunity cost of making that good increases (what has to be given up in terms of other goods and services that could have been produced using the same resources), and a higher price is an incentive to bear the higher opportunity cost. (1)
Supply Shifters
Now we will look at other factors, besides the price of a good itself that affect supply. When changing, these factors affect the supply curve by shifting it to the right (if supply increases) or to the left (if supply decreases). Thus, in our demand and supply model, we will refer to the following factors as supply shifters.
Notice that for a good or service, there might be other important factors that affect supply, thus this list can be thought of as a theoretical list, which will cover the most important determinants of supply.
- Prices of related goods
- Substitutes in production
- Complements in production
- Prices of resources and other inputs
- Expectations in general
- Expected future prices for the good produced
- Expected future prices of inputs used to produce the good
- Number of sellers (market supply depends on number of sellers)
- Productivity (Technology improvements)
If one of these factors changes, the supply curve shifts .
- If supply increases, the supply curve shifts right. Why? (The quantity demanded (on the horizontal quantity axis) increases when we move from 0 to + infinity, thus from left to right)
- If supply decreases, the supply curve shifts left. Why? (When moving from right to left (towards 0) the quantity supplied decreases on the quantity axis)
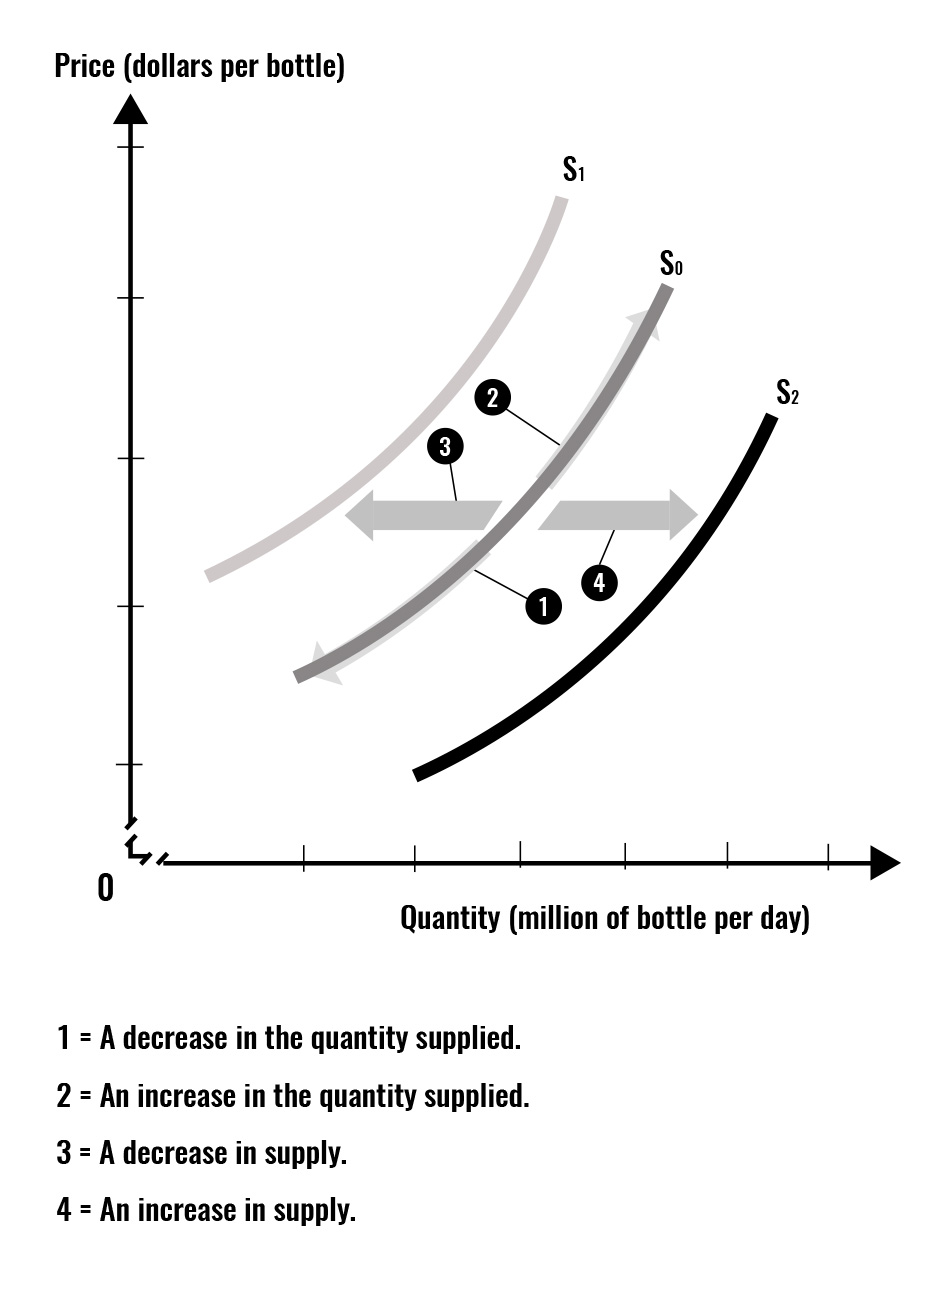
The graph summarizes supply shifters leading to an increase or decrease in supply. In addition it emphasizes that what causes amovement along the supply curve, is the change in the own price of the good or service. (1)
- Authored by: Florida State College at Jacksonville. License: CC BY: Attribution
- Principles of Macroeconomics. Authored by: OpenStax. Located at: http://cnx.org/contents/4061c832-098e-4b3c-a1d9-7eb593a2cb31@11.11. License: CC BY: Attribution