Chemistry LibreTexts

11.20: Stellar Distances

  • Page ID
    244319
  • \( \newcommand{\vecs}[1]{\overset { \scriptstyle \rightharpoonup} {\mathbf{#1}} } \) \( \newcommand{\vecd}[1]{\overset{-\!-\!\rightharpoonup}{\vphantom{a}\smash {#1}}} \)\(\newcommand{\id}{\mathrm{id}}\) \( \newcommand{\Span}{\mathrm{span}}\) \( \newcommand{\kernel}{\mathrm{null}\,}\) \( \newcommand{\range}{\mathrm{range}\,}\) \( \newcommand{\RealPart}{\mathrm{Re}}\) \( \newcommand{\ImaginaryPart}{\mathrm{Im}}\) \( \newcommand{\Argument}{\mathrm{Arg}}\) \( \newcommand{\norm}[1]{\| #1 \|}\) \( \newcommand{\inner}[2]{\langle #1, #2 \rangle}\) \( \newcommand{\Span}{\mathrm{span}}\) \(\newcommand{\id}{\mathrm{id}}\) \( \newcommand{\Span}{\mathrm{span}}\) \( \newcommand{\kernel}{\mathrm{null}\,}\) \( \newcommand{\range}{\mathrm{range}\,}\) \( \newcommand{\RealPart}{\mathrm{Re}}\) \( \newcommand{\ImaginaryPart}{\mathrm{Im}}\) \( \newcommand{\Argument}{\mathrm{Arg}}\) \( \newcommand{\norm}[1]{\| #1 \|}\) \( \newcommand{\inner}[2]{\langle #1, #2 \rangle}\) \( \newcommand{\Span}{\mathrm{span}}\)\(\newcommand{\AA}{\unicode[.8,0]{x212B}}\)

    figure-183-stellarDistanceDiagram.jpg
    Images courtesy Mike Reynolds, Ph.D. of Florida State College at Jacksonville.

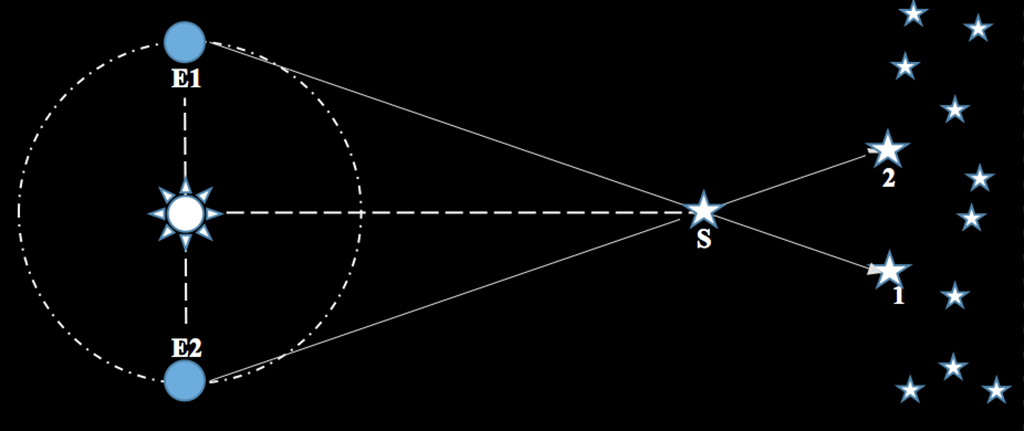
    This diagram (not to scale) shows Earth’s orbit about the Sun. Recall that one orbit is 1 year, 12 months, or 365.24 days. Earth is shown twice, at the 12 o’clock position, or E1 , and at the 6 o’clock position, or E2 . These two positions are six months apart on Earth’s orbit about the Sun. The star being observed is the larger star, indicated by the S . The star S appears to shift against the background of stars from position S1 to position S2 over the six months. This is the parallax motion. By looking at this as a triangle and using trigonometric relationships and the angles, you can determine the distance to the star S .

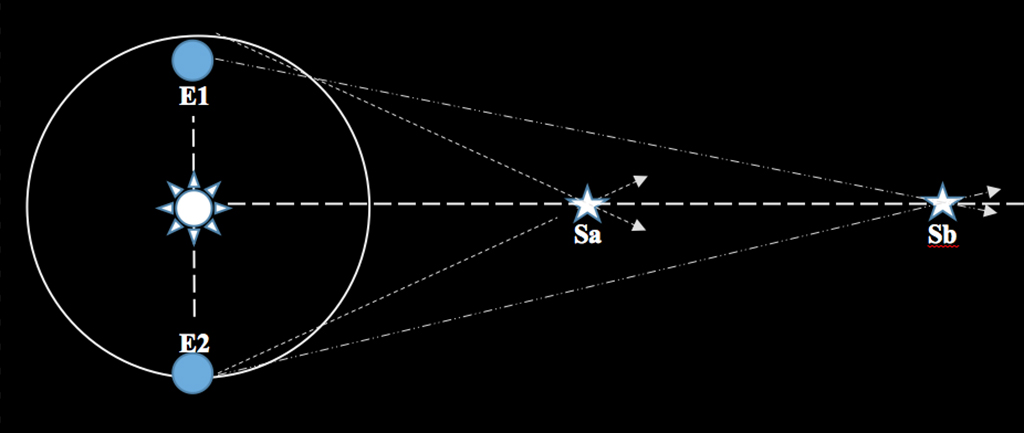
    There are issues with determining stellar parallax, and how useful it is in determining stellar distances. First, note that parallax only works with fairly close stars. Examine this diagram to see what happens when one star is at a greater distance.

    figure-184-stellarDistanceDiagram.jpg
    Images courtesy Mike Reynolds, Ph.D. of Florida State College at Jacksonville.

    As with the first diagram, Earth is at two positions, E1 and E2 . In this diagram and case, there are two stars, Sa and Sb . The background stars in the first diagram have been removed to see the angles and two stars better. Note that star Sb is about two times as far from the Sun and Earth as star S1 . Look at the angles; the E1-Sa-E2 angle is much larger than the E1-Sb-E2 angle. Think of the angles they create as pieces of pizza.

    CC licensed content, Original

    11.20: Stellar Distances is shared under a CC BY 4.0 license and was authored, remixed, and/or curated by LibreTexts.

    • Was this article helpful?