
11.8: The Hertzsprung-Russell Diagram
- Page ID
- 244330
\( \newcommand{\vecs}[1]{\overset { \scriptstyle \rightharpoonup} {\mathbf{#1}} } \) \( \newcommand{\vecd}[1]{\overset{-\!-\!\rightharpoonup}{\vphantom{a}\smash {#1}}} \)\(\newcommand{\id}{\mathrm{id}}\) \( \newcommand{\Span}{\mathrm{span}}\) \( \newcommand{\kernel}{\mathrm{null}\,}\) \( \newcommand{\range}{\mathrm{range}\,}\) \( \newcommand{\RealPart}{\mathrm{Re}}\) \( \newcommand{\ImaginaryPart}{\mathrm{Im}}\) \( \newcommand{\Argument}{\mathrm{Arg}}\) \( \newcommand{\norm}[1]{\| #1 \|}\) \( \newcommand{\inner}[2]{\langle #1, #2 \rangle}\) \( \newcommand{\Span}{\mathrm{span}}\) \(\newcommand{\id}{\mathrm{id}}\) \( \newcommand{\Span}{\mathrm{span}}\) \( \newcommand{\kernel}{\mathrm{null}\,}\) \( \newcommand{\range}{\mathrm{range}\,}\) \( \newcommand{\RealPart}{\mathrm{Re}}\) \( \newcommand{\ImaginaryPart}{\mathrm{Im}}\) \( \newcommand{\Argument}{\mathrm{Arg}}\) \( \newcommand{\norm}[1]{\| #1 \|}\) \( \newcommand{\inner}[2]{\langle #1, #2 \rangle}\) \( \newcommand{\Span}{\mathrm{span}}\)\(\newcommand{\AA}{\unicode[.8,0]{x212B}}\)
The Hertzsprung-Russell diagram , also referred to as the H-R Diagram, is a graph of stellar absolute magnitude or luminosity versus their spectral type or photosphere temperature. The H-R Diagram was created circa 1910 by Danish astronomer Ejnar Hertzsprung and American astronomer Henry Norris Russell . Plotting stellar luminosity versus color (temperature) allowed Hertzsprung Russell to see patterns in stars, from groupings of stars to how stars change over time, what is called stellar evolution.Looking at the H-R Diagram, you will first note that numerous stars are plotted. Imagine millions of stars, that is what makes up the diagram itself.
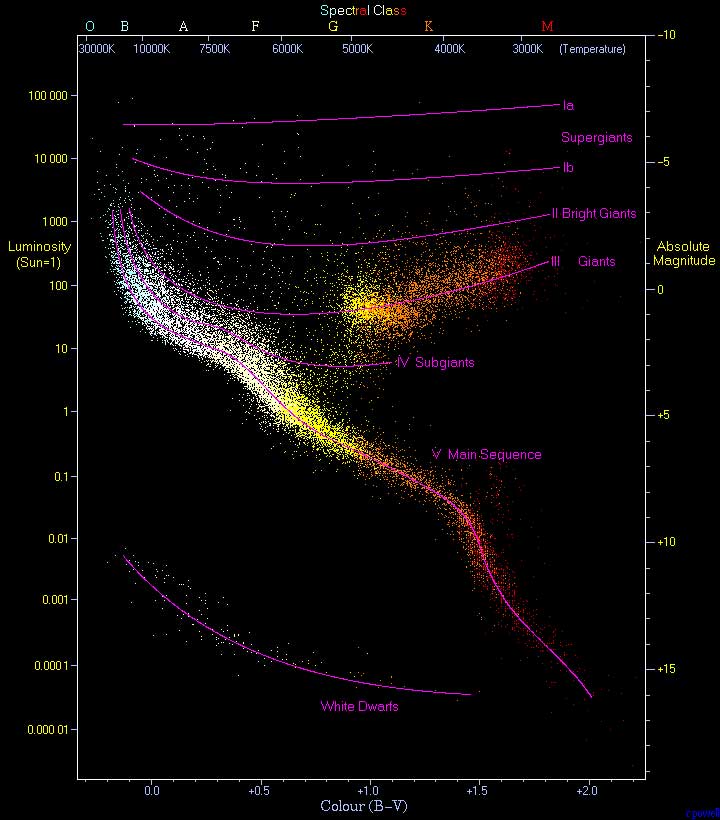
Image courtesy of Florida State College at Jacksonville.
CC BY-SA 2.5 | Image courtesy of Richard Powell.
The graph also shows the colors of the plotted stars — note the stars on the left of the graph are more blue-white, towards the center yellowish, and on the right red to almost a purple color. That indicates the stellar temperature.
As you go higher on the graph, up the Y-axis, the stars are brighter — the stellar luminosity. This can be plotted as the L sun with the L sun = 1. It can also be plotted as Absolute Magnitude, M.
CC licensed content, Original
- Provided by: Florida State College at Jacksonville. License: CC BY: Attribution