
5.18: Putting It Together- Supply and Demand
- Page ID
- 249286
Summary
The goal of this module was to explain how demand and supply for a good or service determine prices and quantities bought and sold. In the process, you learned what factors influence demand and what factors influence supply. You learned how to:
- Describe and differentiate between the major economic systems
- Explain the determinants of demand
- Explain the determinants of supply
- Define and graphically illustrate market equilibrium, surplus, and shortage
Synthesis
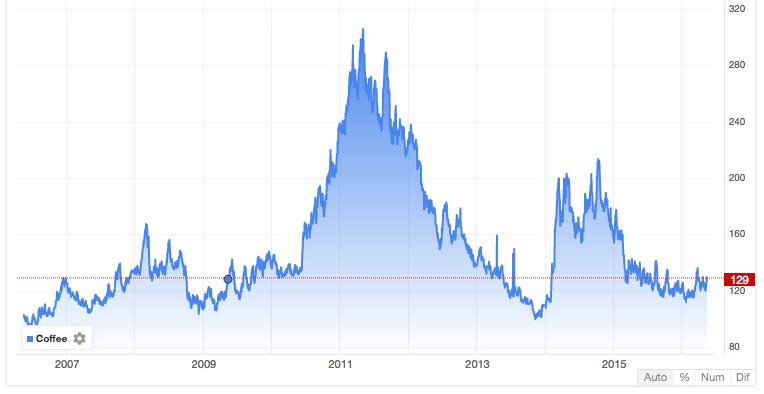
You’ll remember that we started this module by considering changes in global coffee prices. Let’s focus specifically on the drought of 2014.
Now that we understand more about supply and demand, we can answer a few important questions: How does a drought impact supply? What impact will the quantity supplied have on the equilibrium price?
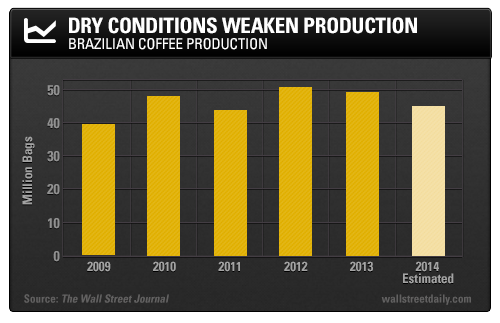
In 2014, the coffee regions of Brazil experienced a serious drought. The lack of rain in Brazil’s coffee-growing region delayed the tree-flowering period, which spans October and November. When the trees don’t flower, they don’t produce coffee. Weather conditions also affect the pollination of coffee trees that have already flowered: Drought makes the blooms very delicate, which can cause them to fall off the tree. In 2014, the combined impact of these consequences meant a 13 percent drop in production from the previous year, to only 48 million 60-kilogram bags.[1]
These are poor natural conditions for coffee growers, and they cause a reduction in the supply. Graphically, such a reduction means a shift to the left in the supply curve (shown in Figure 3, below), indicating that suppliers are providing less coffee at every price.
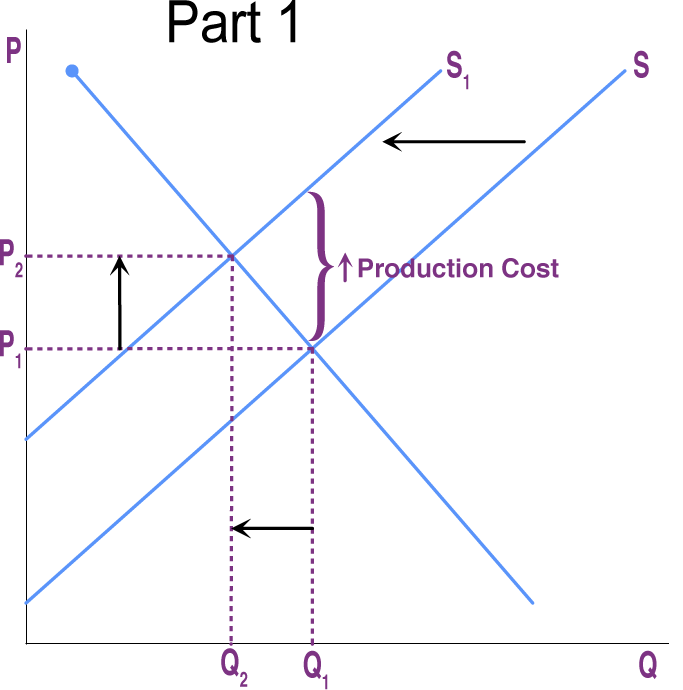
We can see that this shift in the supply curve will change the quantity supplied and the equilibrium price. At the original price (P1), the decrease in supply causes a shortage—more people want coffee at that low price than the suppliers are able to provide. This drives up the price to a new equilibrium level (P2). In short, a leftward shift in the supply curve causes a movement up the demand curve, resulting in a lower equilibrium quantity (Q2) and a higher equilibrium price (P2).
This impact is clear in an economic model like the graph above, but does it really affect consumers? Absolutely!—during this period, Starbucks raised its prices by 8 percent, and Folgers raised its prices by 9 percent. Coffee retailers were able to limit some of the impact of the rising coffee prices by drawing down their stock of green beans that were purchased before the drought and passing on some of the cost on to their customers as a higher price.[2]
It’s very common to see the impact of drought and other natural factors on supply, equilibrium quantity, and equilibrium price. The following video provides a brief example in the United States.

A YouTube element has been excluded from this version of the text. You can view it online here: http://pb.libretexts.org/micro2/?p=160
Will raising the price of coffee cause consumers to drink less coffee? How much of an impact does a price change have on demand? Now that you understand the basic principles of supply and demand, we’re ready to take on these questions in the next module.
- Putting It Together: Supply and Demand. Authored by: Lumen Learning. License: CC BY: Attribution
- Supply and Demand in the Beef Industry. Provided by: BBC. Located at: https://www.youtube.com/embed/xBU8Z0Accds. License: CC BY-NC-ND: Attribution-NonCommercial-NoDerivatives