
1.1: Mass Spectrometry
- Page ID
- 294676

Mass spectrometry (MS) is a powerful analytical technique widely used by chemists, biologists, medical researchers, and environmental and forensic scientists, among others. With MS, we are looking at the mass of a molecule, or of different fragments of that molecule.
The basics of a mass spectrometry experiment
There are many different types of MS instruments, but they all have the same three essential components. First, there is an ionization source, where the molecule is given a positive electrical charge, either by removing an electron or by adding a proton. Depending on the ionization method used, the ionized molecule may or may not break apart into a population of smaller fragments. In the figure below, some of the sample molecules remain whole, while others fragment into smaller pieces.
Next in line there is a mass analyzer, where the cationic fragments are separated according to their mass.
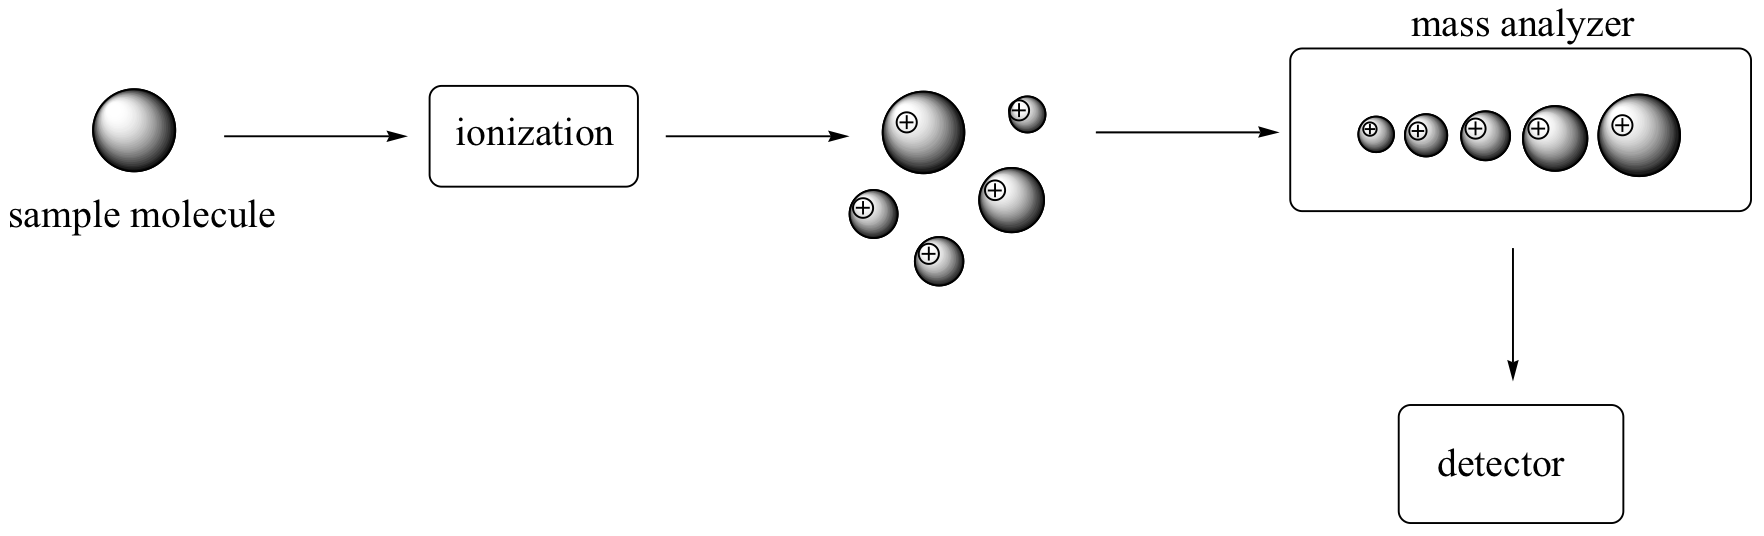
Finally, there is a detector, which detects and quantifies the separated ions.
One of the more common types of MS techniques used in the organic laboratory is electron ionization. In the ionization source, the sample molecule is bombarded by a high-energy electron beam, which has the effect of knocking a valence electron off of the molecule to form a radical cation. Because a great deal of energy is transferred by this bombardment process, the radical cation quickly begins to break up into smaller fragments, some of which are positively charged and some of which are neutral. The neutral fragments are either adsorbed onto the walls of the chamber or are removed by a vacuum source. In the mass analyzer component, the positively charged fragments and any remaining unfragmented molecular ions are accelerated down a tube by an electric field.
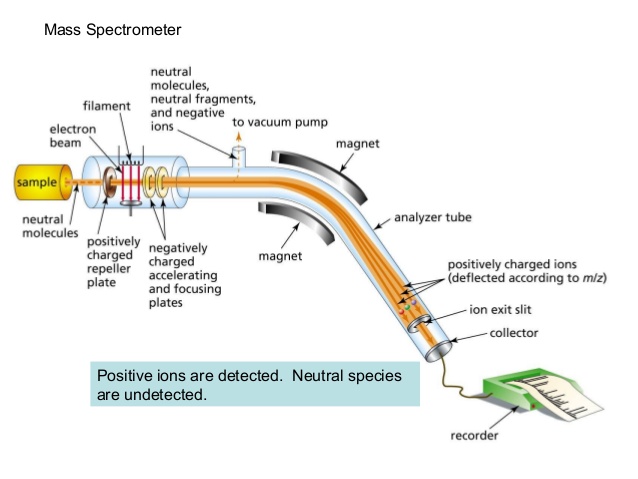
(Image from Wikipedia Commons)
This tube is curved, and the ions are deflected by a strong magnetic field. Ions of different mass to charge (m/z) ratios are deflected to a different extent, resulting in a ‘sorting’ of ions by mass (virtually all ions have charges of z = +1, so sorting by the mass to charge ratio is the same thing as sorting by mass). A detector at the end of the curved flight tube records and quantifies the sorted ions.
Looking at mass spectra
Below is typical output for an electron-ionization MS experiment (MS data in the section is derived from the Spectral Database for Organic Compounds, a free, web-based service provided by AIST in Japan.

The sample is acetone. On the horizontal axis is the value for m/z (as we stated above, the charge z is almost always +1, so in practice this is the same as mass). On the vertical axis is the relative abundance of each ion detected. On this scale, the most abundant ion, called the base peak, is set to 100%, and all other peaks are recorded relative to this value. For acetone, the base peak is at m/z = 43 - we will discuss the formation of this fragment a bit later. The molecular weight of acetone is 58, so we can identify the peak at m/z = 58 as that corresponding to the molecular ion peak, or parent peak. Notice that there is a small peak at m/z = 59: this is referred to as the M+1 peak. How can there be an ion that has a greater mass than the molecular ion? Simple: a small fraction - about 1.1% - of all carbon atoms in nature are actually the 13C rather than the 12C isotope. The 13C isotope is, of course, heavier than 12C by 1 mass unit. In addition, about 0.015% of all hydrogen atoms are actually deuterium, the 2H isotope. So the M+1 peak represents those few acetone molecules in the sample which contained either a 13C or 2H.
Molecules with lots of oxygen atoms sometimes show a small M+2 peak (2 m/z units greater than the parent peak) in their mass spectra, due to the presence of a small amount of 18O (the most abundant isotope of oxygen is 16O). Because there are two abundant isotopes of both chlorine (about 75% 35Cl and 25% 37Cl) and bromine (about 50% 79Br and 50% 81Br), chlorinated and brominated compounds have very large and recognizable M+2 peaks. Fragments containing both isotopes of Br can be seen in the mass spectrum of ethyl bromide:

Much of the utility in electron-ionization MS comes from the fact that the radical cations generated in the electron-bombardment process tend to fragment in predictable ways. Detailed analysis of the typical fragmentation patterns of different functional groups is beyond the scope of this text, but it is worthwhile to see a few representative examples, even if we don’t attempt to understand the exact process by which the fragmentation occurs. We saw, for example, that the base peak in the mass spectrum of acetone is m/z = 43. This is the result of cleavage at the ‘alpha’ position - in other words, at the carbon-carbon bond adjacent to the carbonyl. Alpha cleavage results in the formation of an acylium ion (which accounts for the base peak at m/z = 43) and a methyl radical, which is neutral and therefore not detected.

After the parent peak and the base peak, the next largest peak, at a relative abundance of 23%, is at m/z = 15. This, as you might expect, is the result of formation of a methyl cation, in addition to an acyl radical (which is neutral and not detected).

Exercise 1.1
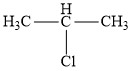
Predict some signals that you would expect to see in a mass spectrum of 2-chloropropane.
- Answer
-
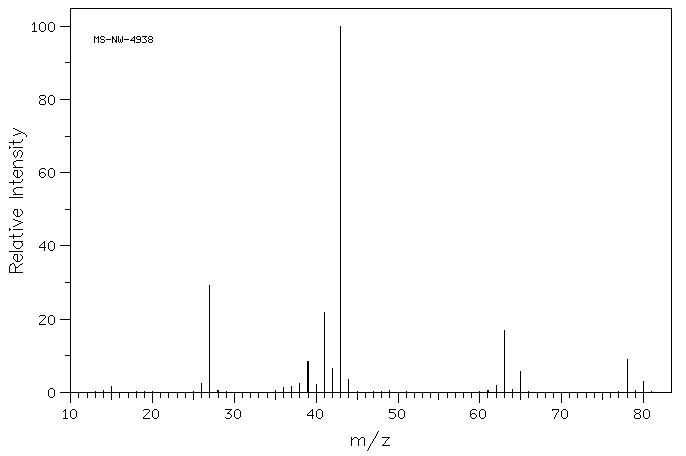
There are two isotopes of Cl, Cl-35 and Cl-37.
The molecular ion appears at 78 which would contain Cl-35 and the peak at 80 contains Cl-37.
This pattern can be quite indicative of a fragment still containing a chlorine atom.
The next major peak grouping occurs at 63 and 65. The relative abundance values of the peaks and the difference of 2 in terms of mass suggest that there is still a chlorine atom in this fragment. The difference in mass from the molecular ion is 15, which based on the molecular formula can only be accounted for by the loss of a CH3 unit. This suggests that these two peaks are due to the fragments CH3CH-35Cl and CH3CH-37Cl.
There is a cluster of peaks around 40. This is a little tougher to interpret. Thinking about the starting molecule, one might consider breaking the C-Cl bond. That would give a fragment of H3CCHCH3 which would have a mass of 43 matching the highest intensity peak.
The mass of chlorine on the periodic table is closer to 35 than 37 indicating that the Cl-35 isotope is more abundant that Cl-37. This can also be seen in the molecular ion. One might consider saying that the peak at 41 is just due to the other isotope of chlorine. However, the peak at 43 does not contain chlorine and the relative ratio of 43 to 41 does not support the presence of chlorine. It is much more likely that the peak at 41 is due to loss of two hydrogen atoms from the fragment with a mass of 43. Which specific hydrogen atoms is well beyond the scope of this course, so we will just say the fragment is C3H5.
The final major peak has a mass of 27. This would correspond to a fragment of C2H3.
The spectrum was obtained from SDBSWeb. (National Institute of Advanced Industrial Science and Technology, 1/18/21).
Gas Chromatography - Mass Spectrometry
Quite often, mass spectrometry is used in conjunction with a separation technique called gas chromatography (GC). The combined GC-MS procedure is very useful when dealing with a sample that is a mixture of two or more different compounds, because the various compounds are separated from one another before being subjected individually to MS analysis. We will not go into the details of gas chromatography here, although if you are taking an organic laboratory course you might well get a chance to try your hand at GC, and you will almost certainly be exposed to the conceptually analogous techniques of thin layer and column chromatography. Suffice it to say that in GC, a very small amount of a liquid sample is vaporized, injected into a long, coiled metal column, and pushed though the column by helium gas. Along the way, different compounds in the sample stick to the walls of the column to different extents, and thus travel at different speeds and emerge separately from the end of the column. In GC-MS, each purified compound is sent directly from the end of GC column into the MS instrument, so in the end we get a separate mass spectrum for each of the compounds in the original mixed sample. Because a compound's MS spectrum is a very reliable and reproducible 'fingerprint', we can instruct the instrument to search an MS database and identify each compound in the sample.
Gas chromatography-mass spectrometry (GC-MS) schematic
(Image from Wikipedia by K. Murray)
The extremely high sensitivity of modern GC-MS instrumentation makes it possible to detect and identify very small trace amounts of organic compounds. GC-MS is being used increasingly by environmental chemists to detect the presence of harmful organic contaminants in food and water samples. Airport security screeners also use high-speed GC-MS instruments to look for residue from bomb-making chemicals on checked luggage.
Contributors
Organic Chemistry With a Biological Emphasis by Tim Soderberg (University of Minnesota, Morris)