
2.13: Periodic Trends
- Page ID
- 206546
Learning Objective
- Be able to state how certain properties of atoms vary based on their relative position on the periodic table.
One of the reasons the periodic table is so useful is because its structure allows us to qualitatively determine how some properties of the elements vary versus their position on the periodic table. The variation of properties versus position on the periodic table is called periodic trends. There is no other tool in science that allows us to judge relative properties of a class of objects like this, which makes the periodic table a very useful tool. Many periodic trends are general. There may be a few points where an opposite trend is seen, but there is an overall trend when considered across a whole row or down a whole column of the periodic table.
The first periodic trend we will consider atomic radius. The atomic radius is an indication of the size of an atom. Although the concept of a definite radius of an atom is a bit fuzzy, atoms behave as if they have a certain radius. Such radii can be estimated from various experimental techniques, such as the x-ray crystallography of crystals.
As you go down a column of the periodic table, the atomic radii increase. This is because the valence electron shell is getting a larger and there is a larger principal quantum number, so the valence shell lies physically farther away from the nucleus. This trend can be summarized as follows:
\[as\downarrow PT,atomic\; radius \uparrow\]
where PT stands for periodic table. Going across a row on the periodic table, left to right, the trend is different. This is because although the valence shell maintains the same principal quantum number, the number of protons-and hence the nuclear charge-is increasing as you go across the row. The increasing positive charge casts a tighter grip on the valence electrons, so as you go across the periodic table, the atomic radii decrease. Again, we can summarize this trend as follows:
\[as\rightarrow PT,atomic\; radius \downarrow\]
Figure \(\PageIndex{1}\) shows spheres representing the atoms of the s and p blocks from the periodic table to scale, showing the two trends for the atomic radius.

Example \(\PageIndex{1}\): Atomic Radii
Referring only to a periodic table and not to Figure \(\PageIndex{1}\), which atom is larger in each pair?
- Si or S
- S or Te
Solution
- Si is to the left of S on the periodic table, so it is larger because as you go across the row, the atoms get smaller.
- S is above Te on the periodic table, so Te is larger because as you go down the column, the atoms get larger.
Exercise \(\PageIndex{1}\): Atomic Radii
Referring only to a periodic table and not to Figure \(\PageIndex{1}\), which atom is smaller, Ca or Br?
Answer
Br
Ionization energy (IE) is the amount of energy required to remove an electron from an atom in the gas phase:
\[A(g)\rightarrow A^{+}(g)+e^{-}\; \; \; \; \; \Delta H\equiv IE\]
IE is usually expressed in kJ/mol of atoms. A mole is an specified amount of a substance. It is always positive because the removal of an electron always requires that energy be put in (i.e., it is endothermic). IE also shows periodic trends. As you go down the periodic table, it becomes easier to remove an electron from an atom (i.e., IE decreases) because the valence electron is farther away from the nucleus. Thus,
\[as\downarrow PT,\; IE\downarrow\]
However, as you go across the periodic table and the electrons get drawn closer in, it takes more energy to remove an electron; as a result, IE increases:
\[as\rightarrow PT,\; IE\uparrow\]
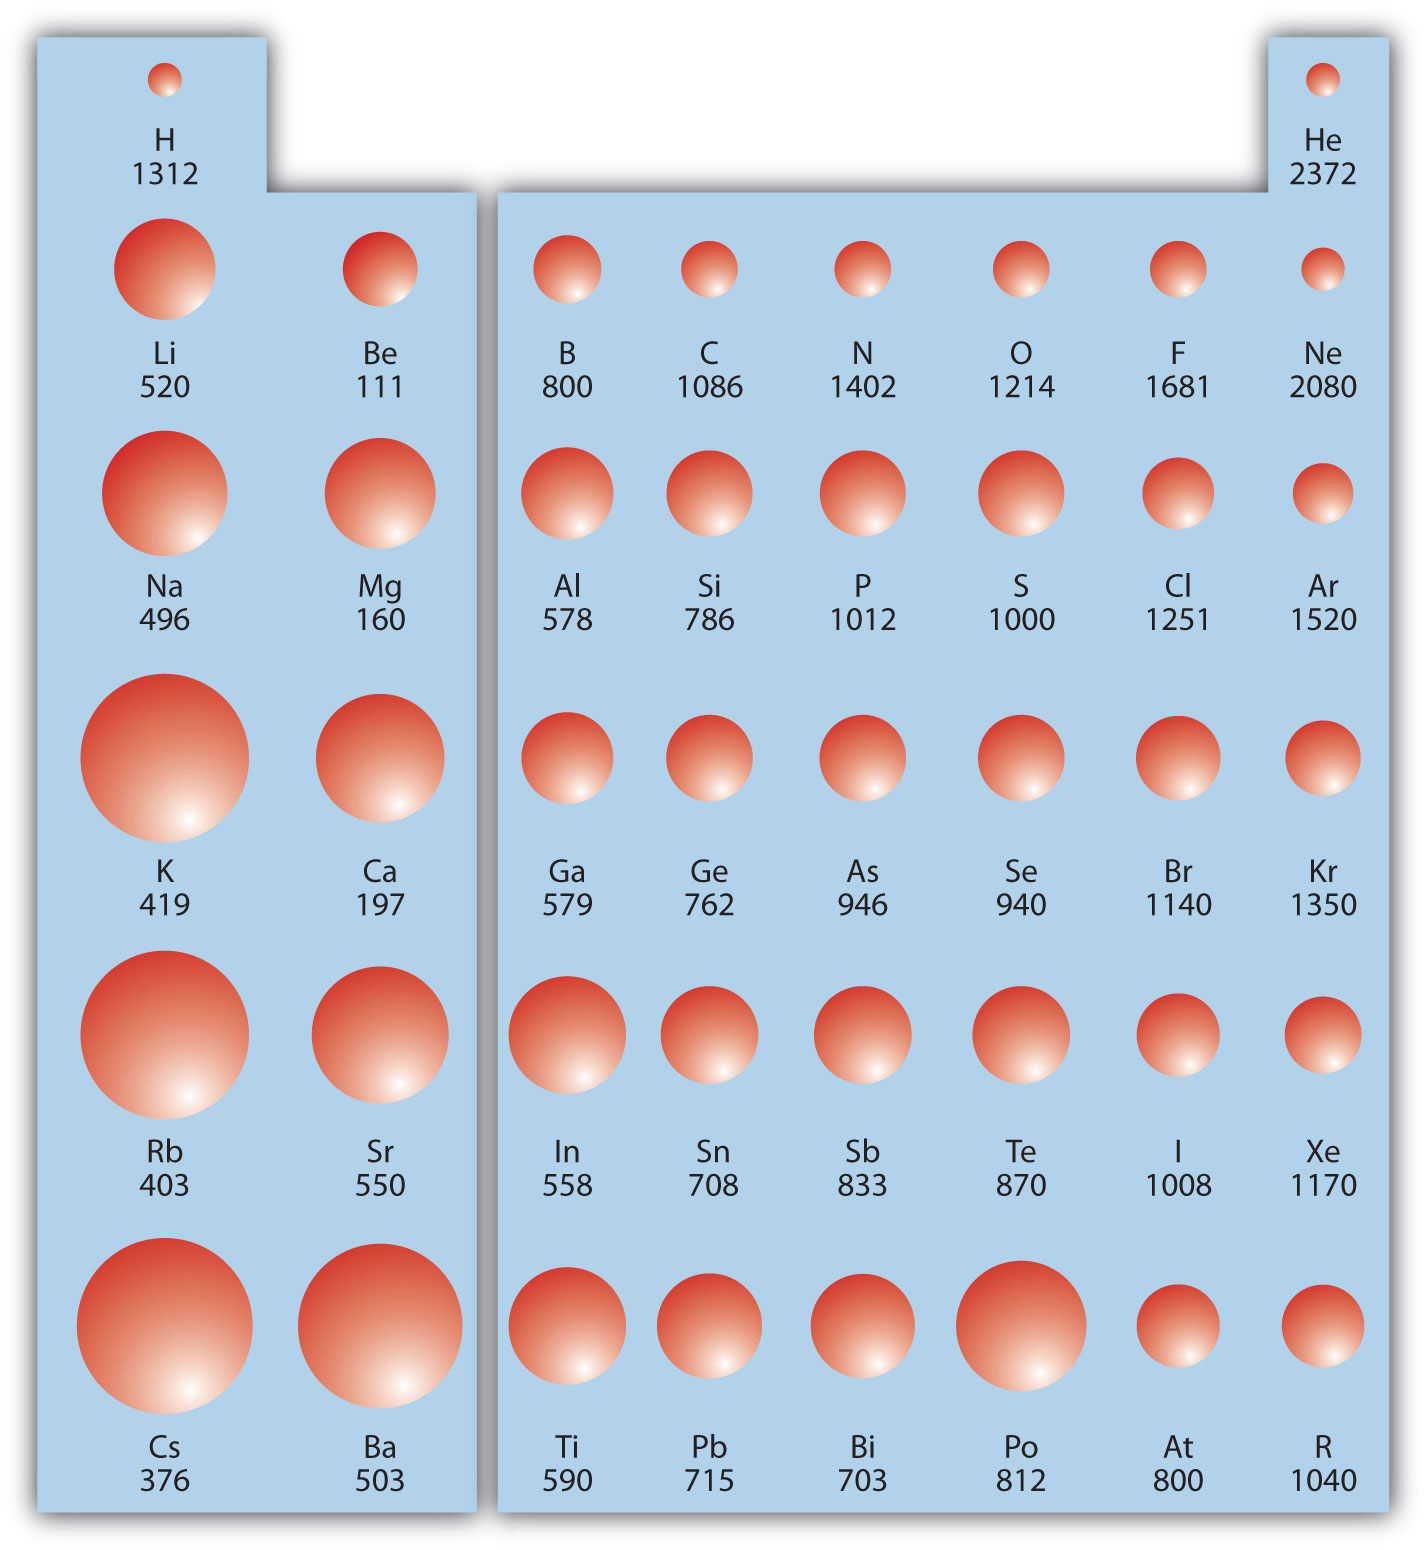
Figure \(\PageIndex{2}\) shows values of IE versus position on the periodic table. Again, the trend isn't absolute, but the general trends going across and down the periodic table should be obvious.
IE also shows an interesting trend within a given atom. This is because more than one IE can be defined by removing successive electrons (if the atom has them to begin with):
- First Ionization Energy (IE1):
\[A(g) → A^+(g) + e^-\]
- Second Ionization Energy (IE2):
\[A^{+}(g) → A^{2+}(g) + e^-\]
- Third Ionization Energy (IE3):
\[A^{2+}(g) → A^{3+}(g) + e^-\]
and so forth.
Each successive IE is larger than the previous because an electron is being removed from an atom with a progressively larger positive charge. However, IE takes a large jump when a successive ionization goes down into a new shell. For example, the following are the first three IEs for Mg, whose electron configuration is 1s22s22p63s2:
First Ionization Energy (IE1) = 738 kJ/mol:
\[Mg(g) → Mg^{+}(g) + e^−\]
- Second Ionization Energy (IE2) = 1,450 kJ/mol:
\[Mg^+(g) → Mg^{2+}(g) + e^−\]
Third Ionization Energy (IE3) = 7,734 kJ/mol:
\[Mg^{2+}(g) → Mg^{3+}(g) + e^− \]
The second IE is twice the first, which is not a surprise: the first IE involves removing an electron from a neutral atom, while the second one involves removing an electron from a positive ion. The third IE, however, is over five times the previous one. Why is it so much larger? Because the first two electrons are removed from the 3s subshell, but the third electron has to be removed from the n = 2 shell (specifically, the 2p subshell, which is lower in energy than the n = 3 shell). Thus, it takes much more energy than just overcoming a larger ionic charge would suggest. It is trends like this that demonstrate that electrons are organized in atoms in groups.
Example \(\PageIndex{2}\): Ionization Energies
Which atom in each pair has the larger first ionization energy?
- Ca or Sr
- K or K+
Solution
- Because Sr is below Ca on the periodic table, it is easier to remove an electron from it; thus, Ca has the higher IE.
- Because K+ has a positive charge, it will be harder to remove another electron from it, so its IE is larger than that of K. Indeed, it will be significantly larger because the next electron in K+ to be removed comes from another shell.
Exercise \(\PageIndex{2}\): Ionization Energies
Which atom has the lower ionization energy, C or F?
Answer
C
The opposite of IE is described by electron affinity (EA), which is the energy change when a gas-phase atom accepts an electron. This is a concept you can learn about in general chemistry.
Summary
Certain properties-notably atomic radius, ionization energies, and electron affinities - can be qualitatively understood by the positions of the elements on the periodic table.