3.6 Periodic Trends
- Page ID
- 218241
Skills to Develop
- Describe and explain the observed trends in atomic size, ionization energy, and electron affinity of the elements
The elements in groups (vertical columns) of the periodic table exhibit similar chemical behavior. This similarity occurs because the members of a group have the same number and distribution of electrons in their valence shells. However, there are also other patterns in chemical properties on the periodic table. For example, as we move down a group, the metallic character of the atoms increases. Oxygen, at the top of Group VIA (16), is a colorless gas; in the middle of the group, selenium is a semiconducting solid; and, toward the bottom, polonium is a silver-grey solid that conducts electricity.
As we go across a period from left to right, we add a proton to the nucleus and an electron to the valence shell with each successive element. As we go down the elements in a group, the number of electrons in the valence shell remains constant, but the principal quantum number increases by one each time. An understanding of the electronic structure of the elements allows us to examine some of the properties that govern their chemical behavior. These properties vary periodically as the electronic structure of the elements changes. They are (1) size (radius) of atoms and ions, (2) ionization energies, (3) electron affinities, (4) electronegativities, and (5) the number of valence electrons.
Variation in Covalent Radius
The quantum mechanical picture makes it difficult to establish a definite size of an atom. However, there are several practical ways to define the radius of atoms and, thus, to determine their relative sizes that give roughly similar values. We will use the covalent radius (Figure \(\PageIndex{1}\)), which is defined as one-half the distance between the nuclei of two identical atoms when they are joined by a covalent bond (this measurement is possible because atoms within molecules still retain much of their atomic identity).
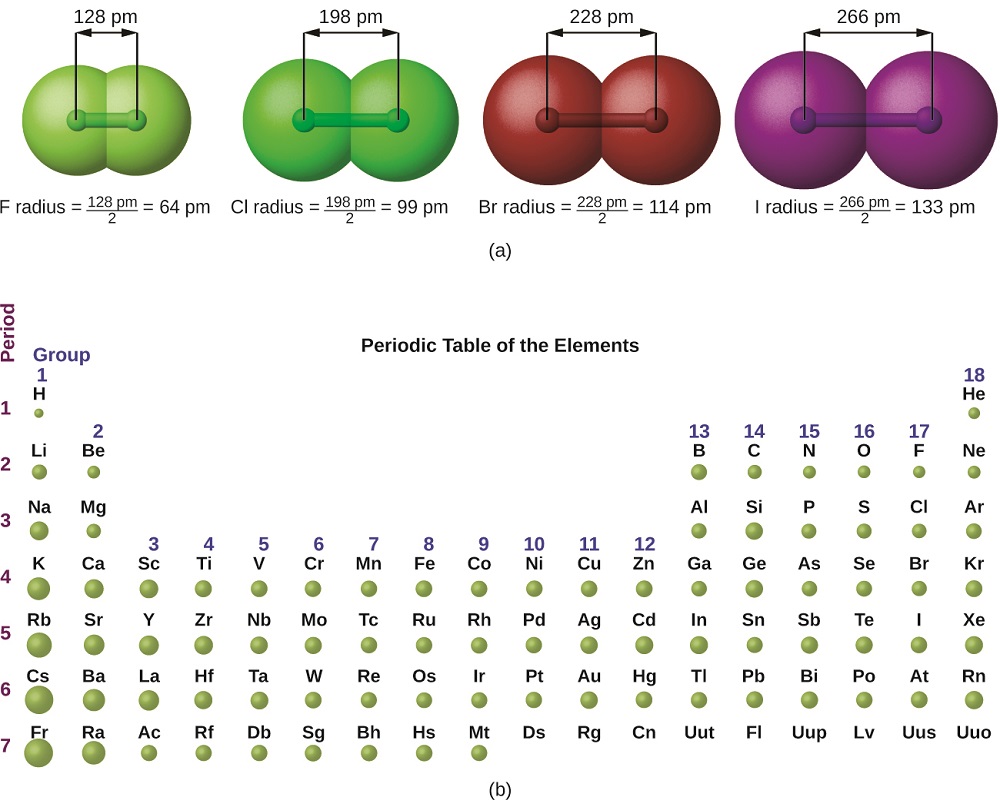
Figure \(\PageIndex{1}\): (a) The radius of an atom is defined as one-half the distance between the nuclei in a molecule consisting of two identical atoms joined by a covalent bond. The atomic radius for the halogens increases down the group as n increases. (b) Covalent radii of the elements are shown to scale. The general trend is that radii increase down a group and decrease across a period.
We know that as we move down a group, the principal quantum number, n, increases by one for each element. Thus, the electrons are being added to a region of space that is increasingly distant from the nucleus. Consequently, the size of the atom (and its covalent radius) must increase as we increase the distance of the outermost electrons from the nucleus. This trend is illustrated for the covalent radii of the halogens in Table \(\PageIndex{1}\) and Figure \(\PageIndex{1}\). The trends for the entire periodic table can be seen in Figure \(\PageIndex{2}\).
| Atom | Covalent radius (pm) | Nuclear charge |
|---|---|---|
| F | 64 | +9 |
| Cl | 99 | +17 |
| Br | 114 | +35 |
| I | 133 | +53 |
| At | 148 | +85 |
As shown in Figure \(\PageIndex{2}\), as we move across a period from left to right, we generally find that each element has a smaller covalent radius than the element preceding it. This trend can be explained with the concept of effective nuclear charge, \(Z_{eff}\). This is the pull exerted on a specific electron by the nucleus, taking into account any electron–electron repulsions. For hydrogen, there is only one electron and so the nuclear charge (Z) and the effective nuclear charge (Zeff) are equal. For all other atoms, the inner electrons partially shield the outer electrons from the pull of the nucleus, and thus:
\[Z_\ce{eff}=Z−shielding\]
Shielding is determined by the probability of another electron being between the electron of interest and the nucleus, as well as by the electron–electron repulsions the electron of interest encounters. Core electrons are adept at shielding, while electrons in the same valence shell do not block the nuclear attraction experienced by each other as efficiently. Thus, each time we move from one element to the next across a period, Z increases by one, but the shielding increases only slightly. Thus, Zeff increases as we move from left to right across a period. The stronger pull (higher effective nuclear charge) experienced by electrons on the right side of the periodic table draws them closer to the nucleus, making the covalent radii smaller.
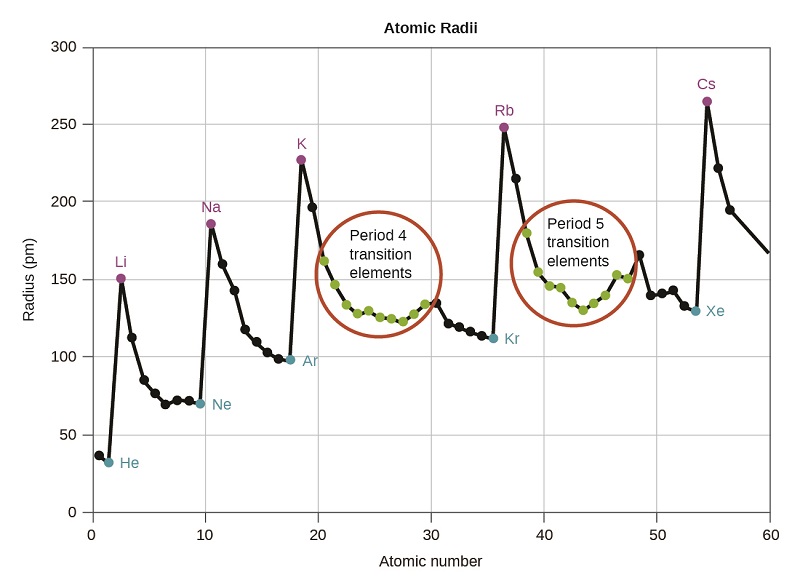
Figure \(\PageIndex{2}\): Within each period, the trend in atomic radius decreases as Z increases; for example, from K to Kr. Within each group (e.g., the alkali metals shown in purple), the trend is that atomic radius increases as Z increases.
Thus, as we would expect, the outermost or valence electrons are easiest to remove because they have the highest energies, are shielded more, and are farthest from the nucleus. As a general rule, when the representative elements form cations, they do so by the loss of the s or p electrons that are farthest from the nucleus.
Example \(\PageIndex{1}\): Sorting Atomic Radii
Predict the order of increasing covalent radius for Ge, Fl, Br, Kr.
Solution
Radius increases as we move down a group, so Ge < Fl (Note: Fl is the symbol for flerovium, element 114, NOT fluorine). Radius decreases as we move across a period, so Kr < Br < Ge. Putting the trends together, we obtain Kr < Br < Ge < Fl.
Exercise \(\PageIndex{1}\)
Give an example of an atom whose size is smaller than fluorine.
- Answer
-
Ne or He
Variation in Ionization Energies
The amount of energy required to remove the most loosely bound electron from a gaseous atom in its ground state is called its first ionization energy (IE1). The first ionization energy for an element, X, is the energy required to form a cation with +1 charge:
The energy required to remove the second most loosely bound electron is called the second ionization energy (IE2).
The energy required to remove the third electron is the third ionization energy, and so on. Energy is always required to remove electrons from atoms or ions, so ionization processes are endothermic and IE values are always positive. For larger atoms, the most loosely bound electron is located farthest from the nucleus and so is easier to remove. Thus, as size (atomic radius) increases, the ionization energy should decrease. Relating this logic to what we have just learned about radii, we would expect first ionization energies to decrease down a group and to increase across a period.
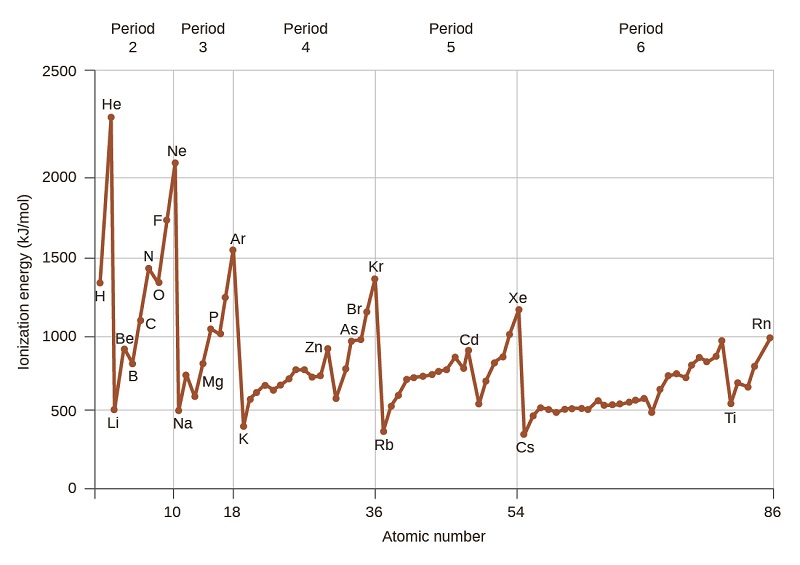
Figure \(\PageIndex{4}\): The first ionization energy of the elements in the first five periods are plotted against their atomic number.
Figure \(\PageIndex{4}\) graphs the relationship between the first ionization energy and the atomic number of several elements. Within a period, the values of first ionization energy for the elements (IE1) generally increases with increasing Z. Down a group, the IE1 value generally decreases with increasing Z. There are some systematic deviations from this trend, however we will not attempt to explain them in this course.
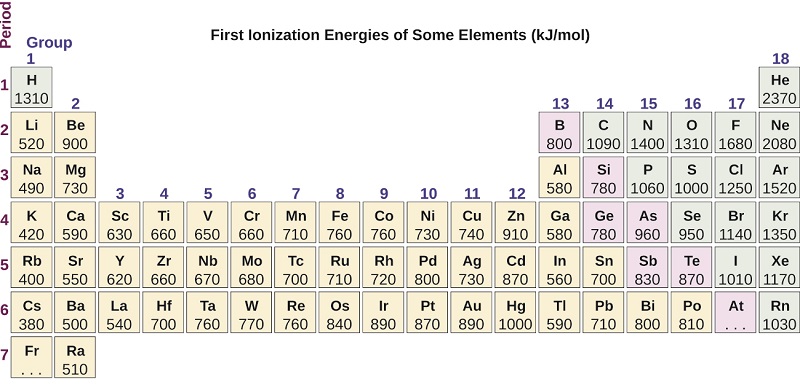
Figure \(\PageIndex{5}\): This version of the periodic table shows the first ionization energy of (IE: 1), in kJ/mol, of selected elements.
Example \(\PageIndex{2}\): Ranking Ionization Energies
Predict the order of increasing energy for the following processes: IE1 for F, IE1 for Se, IE1 for N, IE1 for At.
Solution
Removing the highest energy electron requires less energy the farther an electron is away from the nucleus. The size of the atoms is At > Se > N > F, so the IE trend is the reverse:
IE1(At) < IE1(Se) < IE3(N) < IE2(F).
Exercise \(\PageIndex{2}\)
Which has the lowest value for IE1: O, Po, Pb, or Ba?
- Answer
-
Ba
Variation in Electron Affinities
The electron affinity [EA] is the energy change for the process of adding an electron to a gaseous atom to form an anion (negative ion).
This process can be either endothermic or exothermic, depending on the element. The EA of some of the elements is given in Figure \(\PageIndex{6}\). You can see that many of these elements have negative values of EA, which means that energy is released when the gaseous atom accepts an electron. However, for some elements, energy is required for the atom to become negatively charged and the value of their EA is positive. There are good explanations for the variations in EA, but we will not discuss them in this class.
Just as with ionization energy, subsequent EA values are associated with forming ions with greater charges. The second EA is the energy associated with adding an electron to an anion to form a –2 ion, and so on.
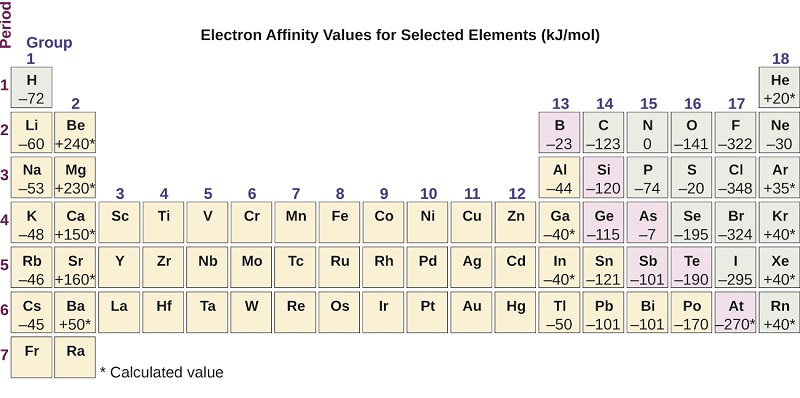
Figure \(\PageIndex{6}\): This version of the periodic table displays the electron affinity values (in kJ/mol) for selected elements.:
The properties discussed in this section (size of atoms, ionization energies, and electron affinities) are central to understanding chemical reactivity. For example, because fluorine has an energetically favorable EA and a large energy barrier to ionization (IE), it is much easier to form fluorine anions than cations. Metallic properties including conductivity and malleability (the ability to be formed into sheets) depend on having electrons that can be removed easily. Thus, metallic character increases as we move down a group and decreases across a period in the same trend observed for atomic size because it is easier to remove an electron that is farther away from the nucleus.
Variation in Electronegativity
The elements with the highest ionization energies are generally those with the most negative electron affinities, which are located toward the upper right corner of the periodic table. Conversely, the elements with the lowest ionization energies are generally those with the least negative electron affinities and are located in the lower left corner of the periodic table.
Because the tendency of an element to gain or lose electrons is so important in determining its chemistry, various methods have been developed to quantitatively describe this tendency. The most important method uses a measurement called electronegativity, defined as the relative ability of an atom to attract electrons to itself in a chemical compound. Elements with high electronegativities tend to acquire electrons in chemical reactions and are found in the upper right corner of the periodic table. Elements with low electronegativities tend to lose electrons in chemical reactions and are found in the lower left corner of the periodic table.
Unlike ionization energy or electron affinity, the electronegativity of an atom is not a simple, fixed property that can be directly measured in a single experiment. In fact, an atom’s electronegativity should depend to some extent on its chemical environment because the properties of an atom are influenced by its neighbors in a chemical compound. Nevertheless, when different methods for assigning the electronegativity of an atom are compared, they all tend to assign similar relative values to a given element. For example, all scales predict that fluorine has the highest electronegativity and cesium the lowest of the stable elements, which suggests that all the methods are measuring the same fundamental property.
Electronegativity is defined as the ability of an atom in a particular molecule to attract electrons to itself. The greater the value, the greater the attractiveness for electrons.
Electronegativity is a function of:
- the atom's ionization energy (how strongly the atom holds on to its own electrons) and
- the atom's electron affinity (how strongly the atom attracts other electrons).
Both of these are properties of the isolated atom. An element will be highly electronegative if it has a large (negative) electron affinity and a high ionization energy (always endothermic, or positive, for neutral atoms). Thus, it will attract electrons from other atoms and resist having its own electrons attracted away.
The Pauling Electronegativity Scale
The original electronegativity scale, developed in the 1930s by Linus Pauling (1901– 1994) was based on measurements of the strengths of covalent bonds between different elements. Pauling arbitrarily set the electronegativity of fluorine at 4.0 (although today it has been refined to 4.09), thereby creating a scale in which all elements have values between 0 and 4.0.
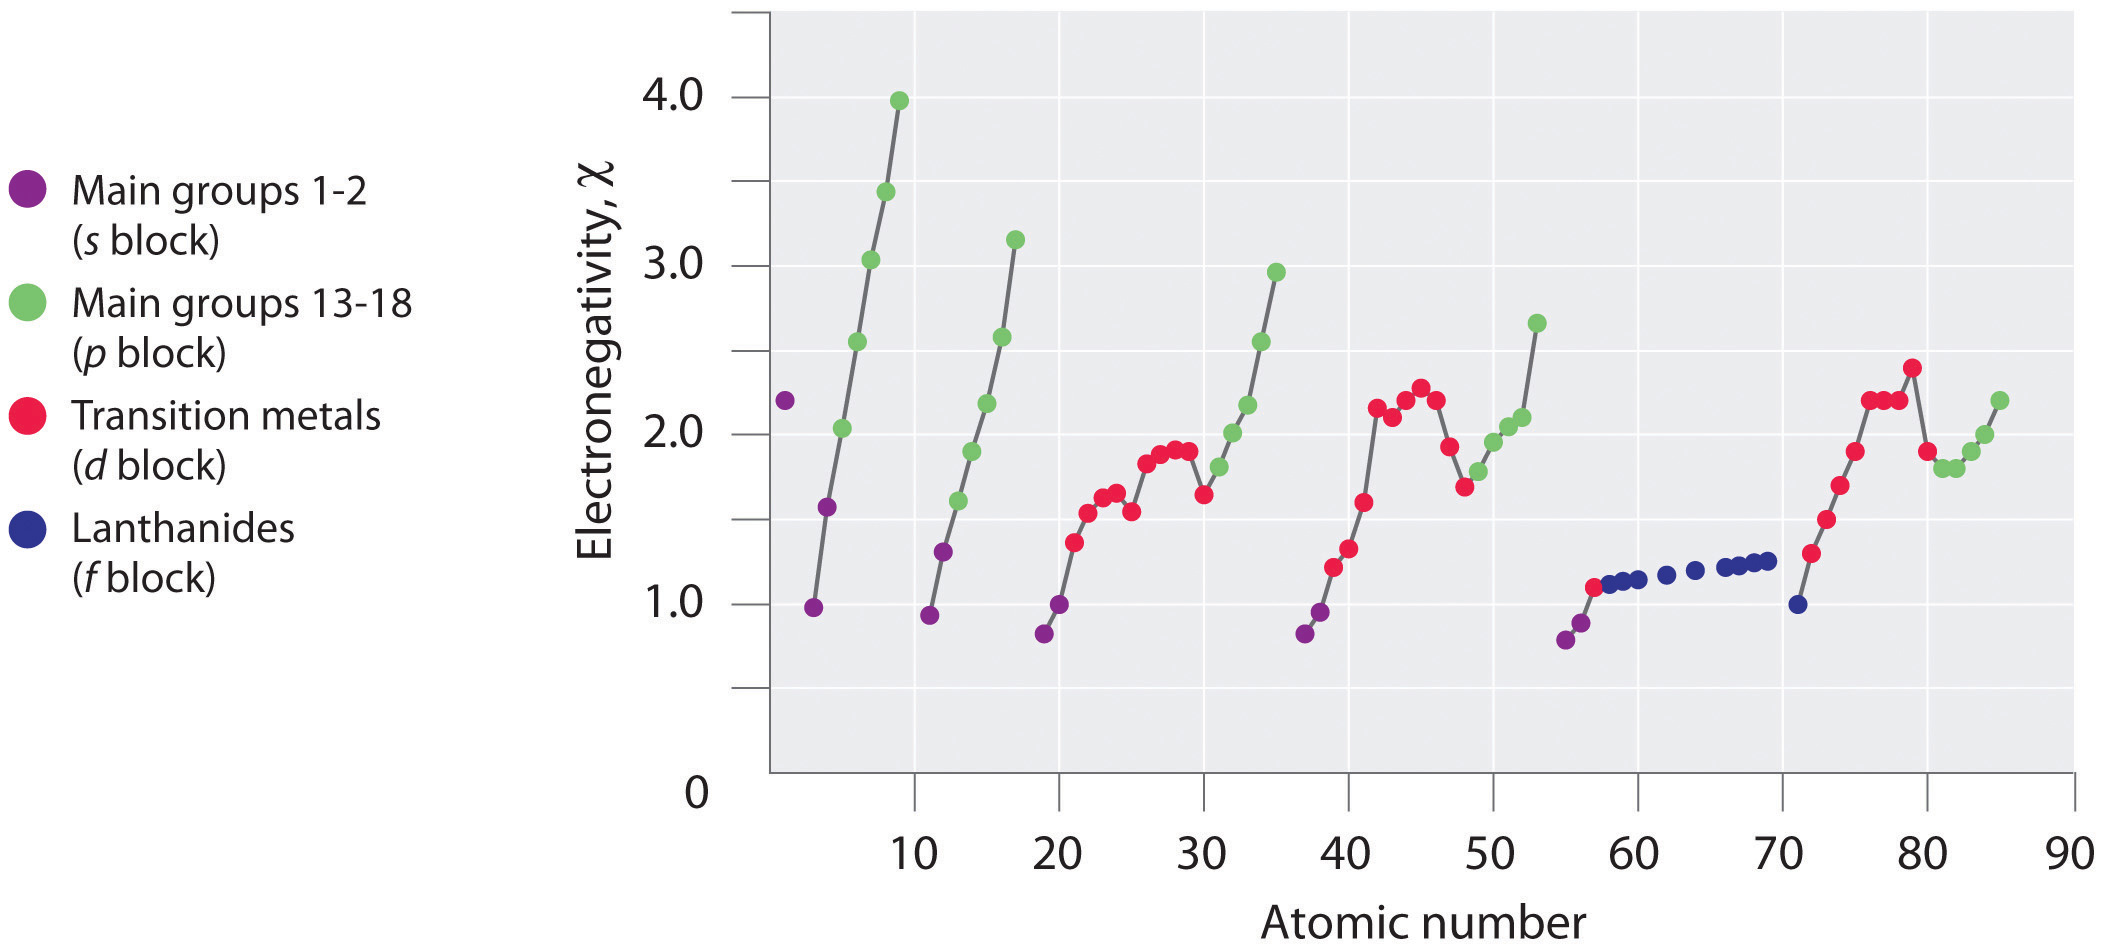
Figure \(\PageIndex{1}\): A Plot of Periodic Variation of Electronegativity with Atomic Number for the First Six Rows of the Periodic Table
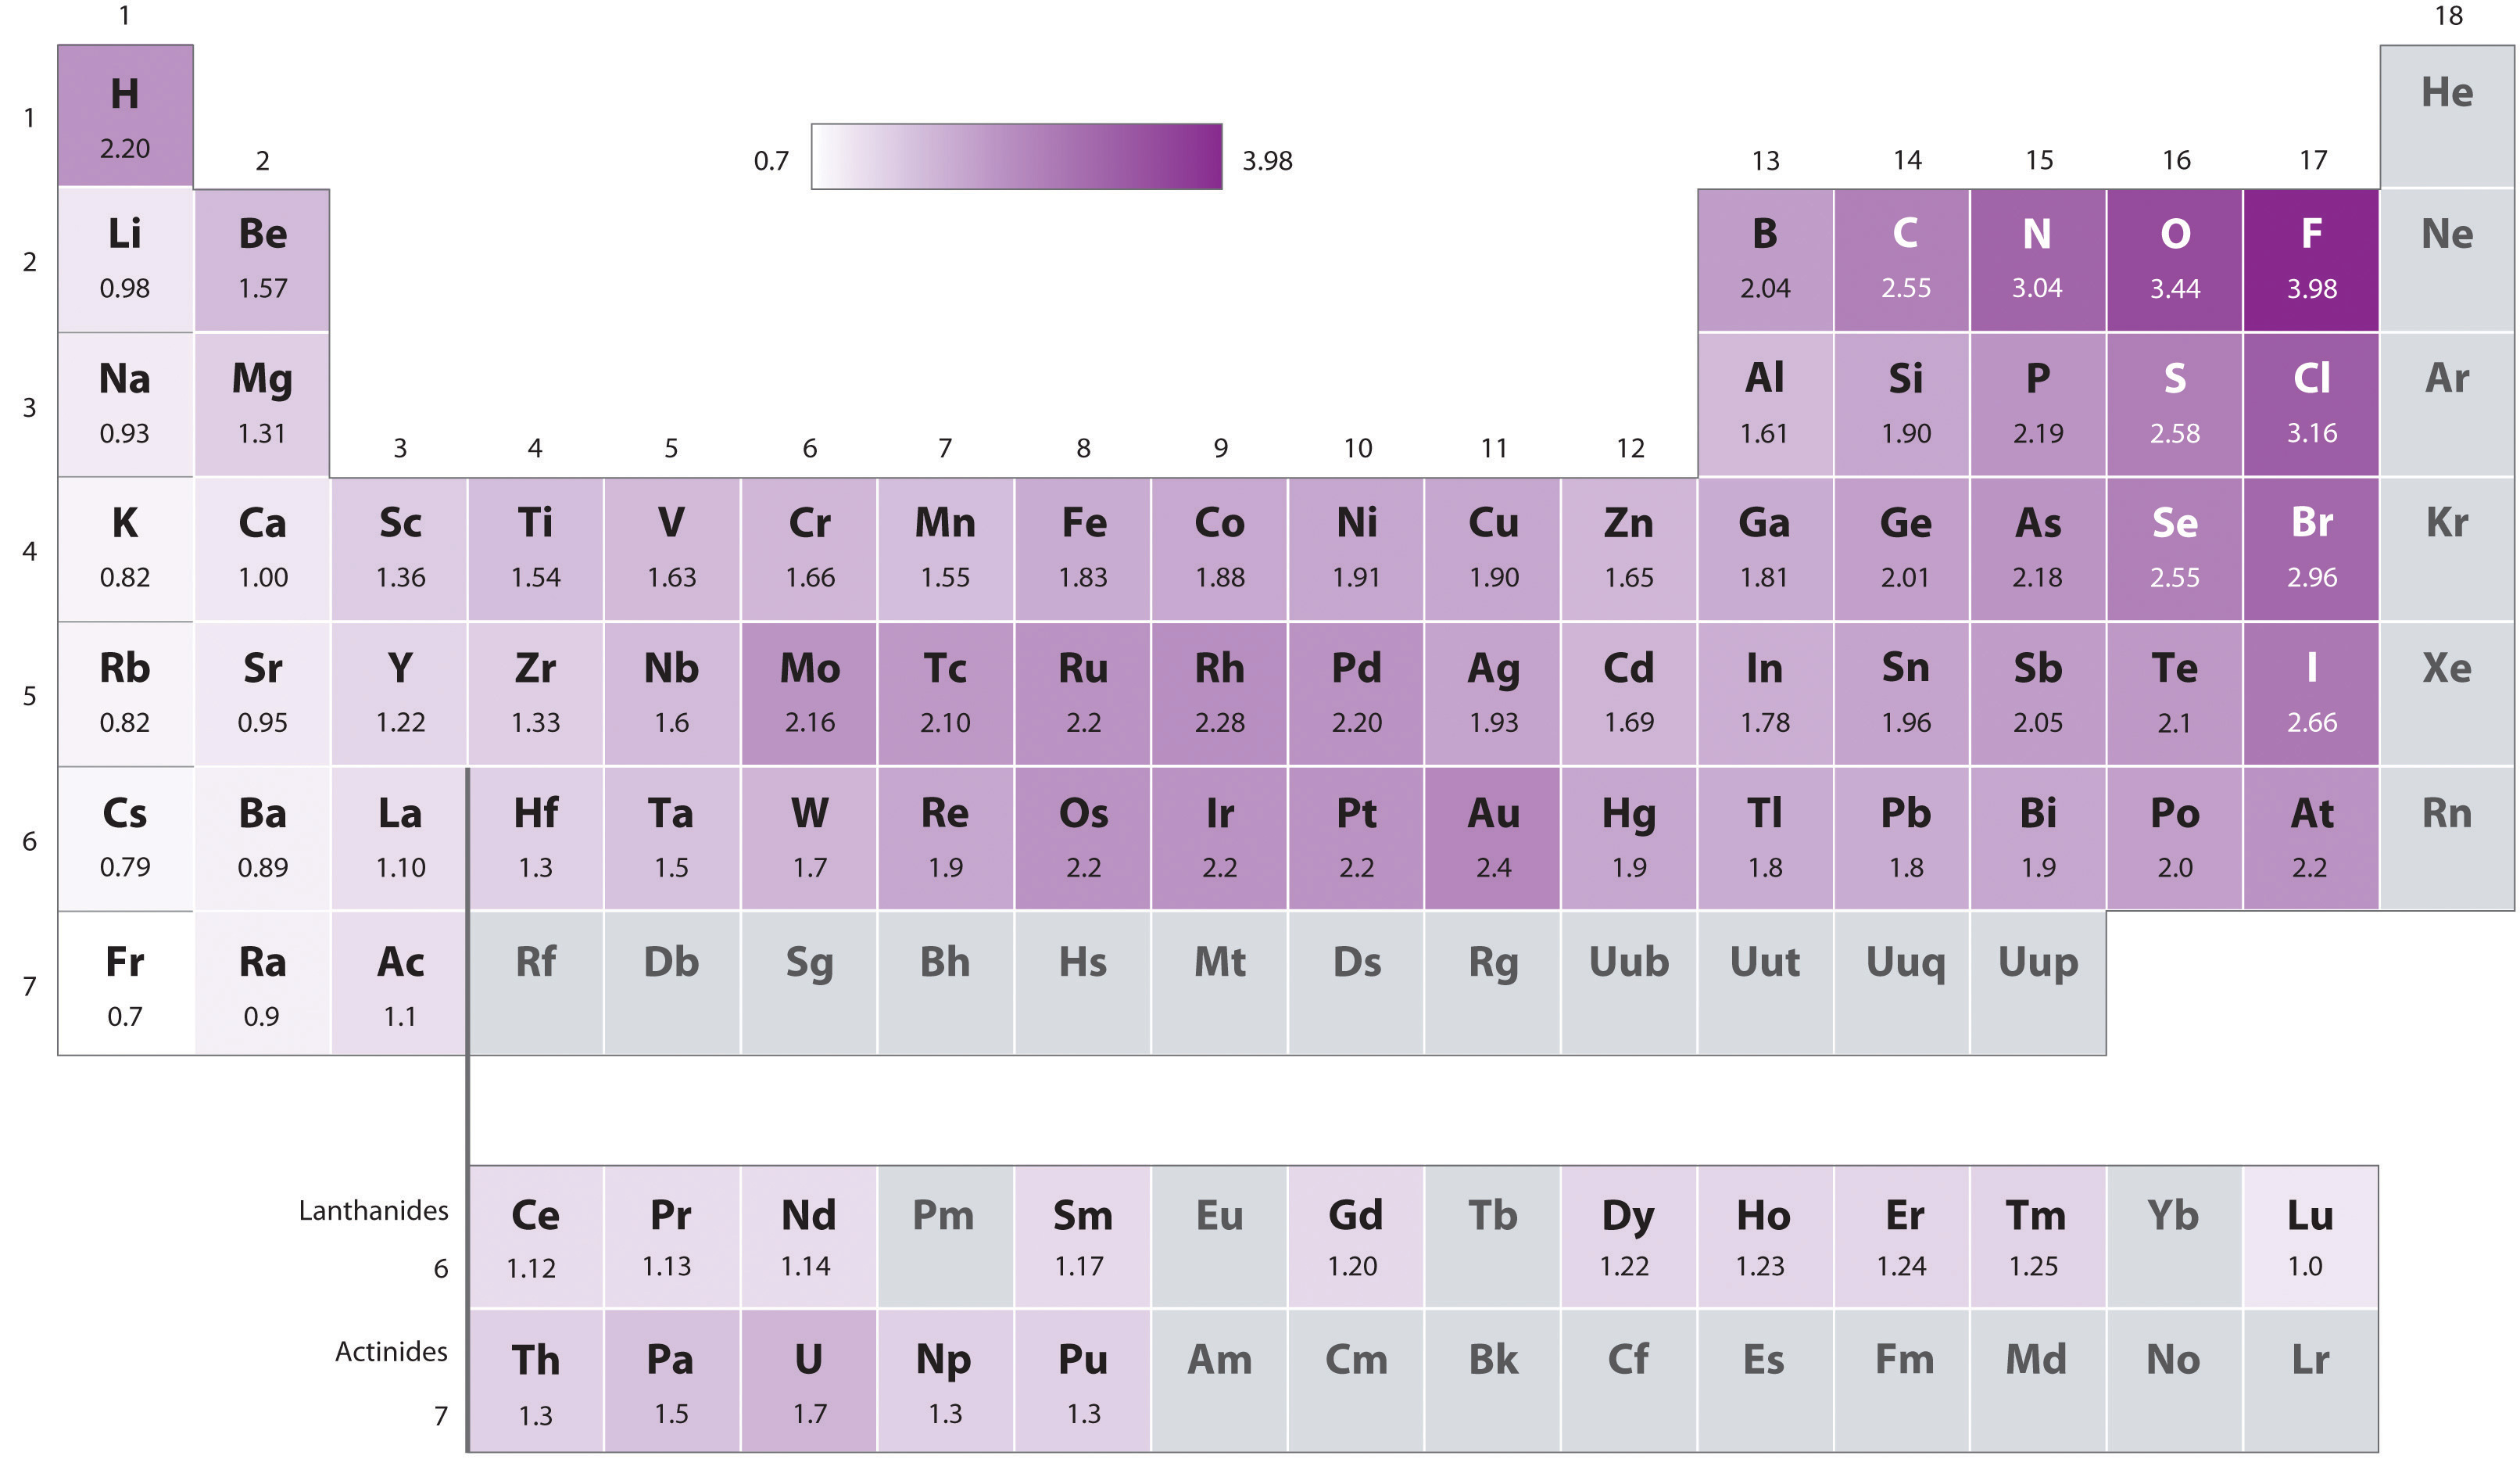
Periodic variations in Pauling’s electronegativity values are illustrated in Figures \(\PageIndex{1}\) and \(\PageIndex{2}\). If we ignore the inert gases and elements for which no stable isotopes are known, we see that fluorine (\(\chi = 3.98\)) is the most electronegative element and cesium is the least electronegative nonradioactive element (\(\chi = 0.79\)). Because electronegativities generally increase diagonally from the lower left to the upper right of the periodic table, elements lying on diagonal lines running from upper left to lower right tend to have comparable values (e.g., O and Cl and N, S, and Br). It is very important to note that the electronegativity of H is similar to that of C.
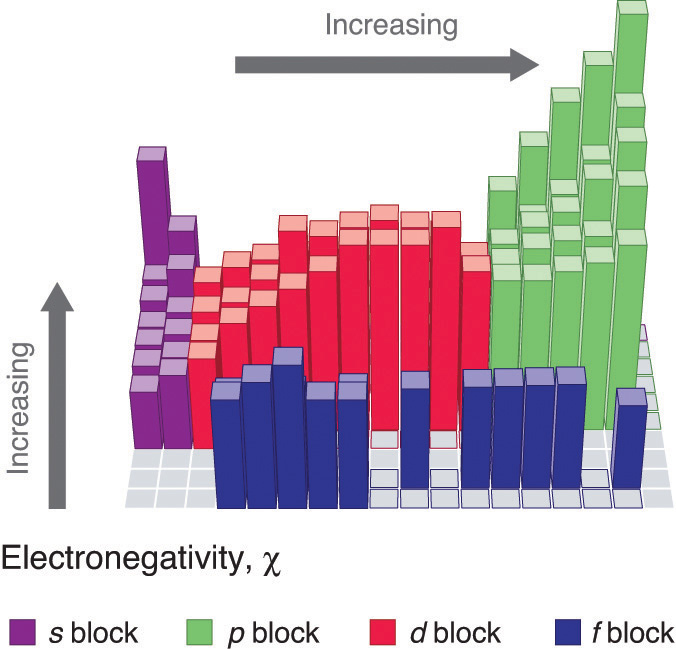
Figure \(\PageIndex{2}\): Pauling Electronegativity Values of the s-, p-, d-, and f-Block Elements. Values for most of the actinides are approximate. Elements for which no data are available are shown in gray. Source: Data from L. Pauling, The Nature of the Chemical Bond, 3rd ed. (1960).
Linus Pauling (1901-1994)
When he was nine, Pauling’s father died, and his mother tried to convince him to quit school to support the family. He did not quit school, but was later denied a high school degree, and had to work several jobs to put himself through college. Pauling would go on to become one of the most influential chemists of the century if not all time. He won two Nobel Prizes, one for chemistry in 1954 and one for peace in 1962.
Pauling’s method is limited by the fact that many elements do not form stable covalent compounds with other elements; hence their electronegativities cannot be measured by his method. Other definitions have since been developed that address this problem, e.g., the Mulliken, Allred-Rochow, and Allen electronegativity scales. The Mulliken electronegativity of an element is the average of its first ionization energy and the absolute value of its electron affinity, showing the relationship between electronegativity and these other periodic properties.
Electronegativity Differences between Metals and Nonmetals
An element’s electronegativity provides us with a single value that we can use to characterize the chemistry of an element. Elements with a high electronegativity (\ ≥ 2.2 in Figure \(\PageIndex{2}\)) have very negative affinities and large ionization potentials, so they are generally nonmetals and electrical insulators that tend to gain electrons in chemical reactions (i.e., they are oxidants). In contrast, elements with a low electronegativity (\(\le1.8\)) have electron affinities that have either positive or small negative values and small ionization potentials, so they are generally metals and good electrical conductors that tend to lose their valence electrons in chemical reactions (i.e., they are reductants). In between the metals and nonmetals, along the heavy diagonal line running from B to At is a group of elements with intermediate electronegativities (~ 2.0). These are the metalloids (or semimetals), elements that have some of the chemical properties of both nonmetals and metals. The distinction between metals and nonmetals is one of the most fundamental we can make in categorizing the elements and predicting their chemical behavior. Figure \(\PageIndex{3}\) shows the strong correlation between electronegativity values, metallic versus nonmetallic character, and location in the periodic table.
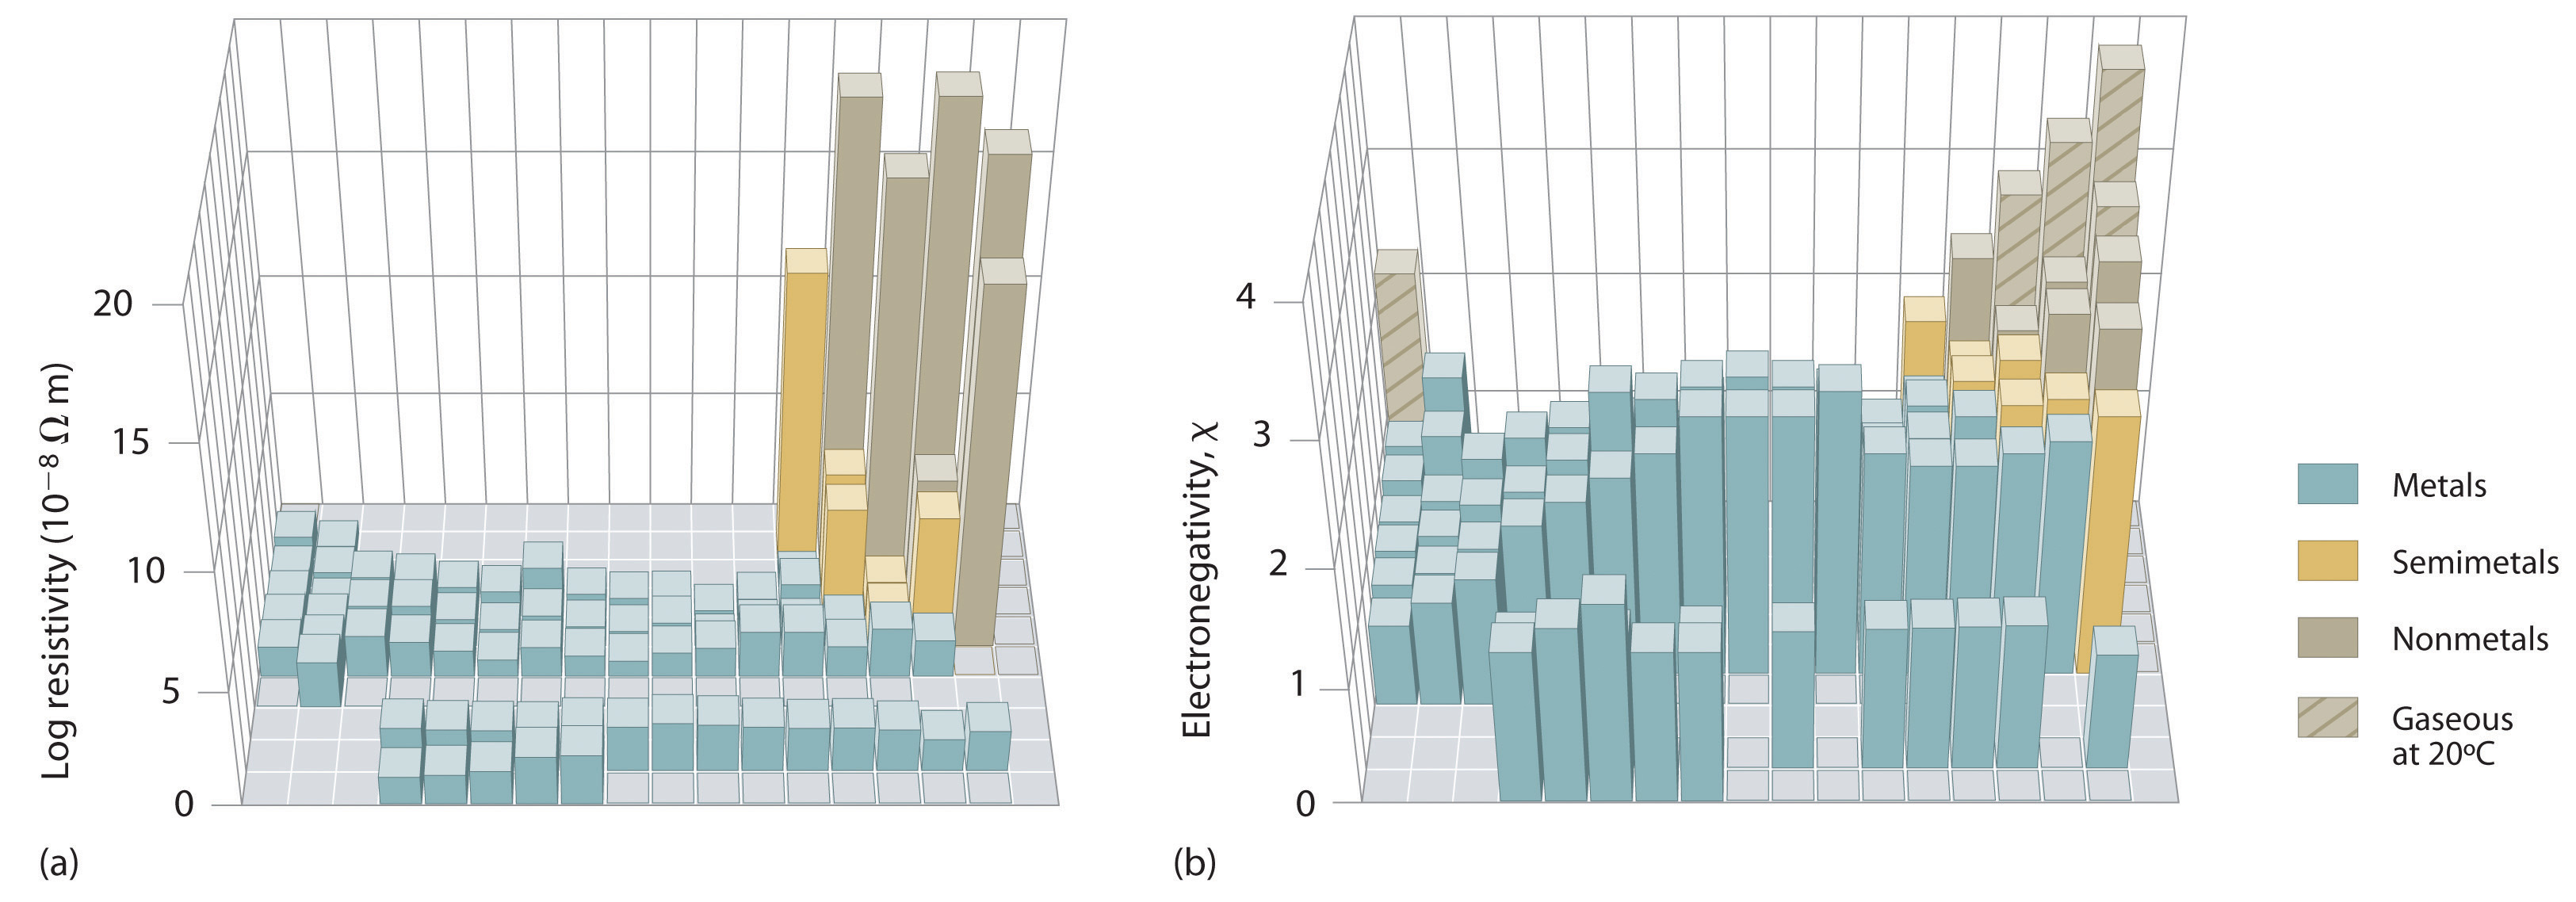
Figure \(\PageIndex{3}\): Three-Dimensional Plots Demonstrating the Relationship between Electronegativity and the Metallic/Nonmetallic Character of the Elements. (a) A plot of electrical resistivity (measured resistivity to electron flow) at or near room temperature shows that substances with high resistivity (little to no measured electron flow) are electrical insulators, whereas substances with low resistivity (high measured electron flow) are metals. (b) A plot of Pauling electronegativities for a like set of elements shows that high electronegativity values (≥ about 2.2) correlate with high electrical resistivities (insulators). Low electronegativity values (≤ about 2.2) correlate with low resistivities (metals). Because electrical resistivity is typically measured only for solids and liquids, the gaseous elements do not appear in part (a).
Electronegativity values increase from lower left to upper right in the periodic table.
The rules for assigning oxidation states are based on the relative electronegativities of the elements; the more electronegative element in a binary compound is assigned a negative oxidation state. As we shall see, electronegativity values are also used to predict bond polarities, and the kinds of reactions that compounds undergo.
Example \(\PageIndex{1}\): Increasing Electronegativity
On the basis of their positions in the periodic table, arrange Cl, Se, Si, and Sr in order of increasing electronegativity and classify each as a metal, a nonmetal, or a metalloid.
Given: four elements
Asked for: order by increasing electronegativity and classification
Strategy:- Locate the elements in the periodic table. From their diagonal positions from lower left to upper right, predict their relative electronegativities.
- Arrange the elements in order of increasing electronegativity.
- Classify each element as a metal, a nonmetal, or a metalloid according to its location about the diagonal belt of metalloids running from B to At.
Solution:
A Electronegativity increases from lower left to upper right in the periodic table (Figure 8.4.2). Because Sr lies far to the left of the other elements given, we can predict that it will have the lowest electronegativity. Because Cl lies above and to the right of Se, we can predict that χCl > χSe. Because Si is located farther from the upper right corner than Se or Cl, its electronegativity should be lower than those of Se and Cl but greater than that of Sr. B The overall order is therefore χSr < χSi < χSe < χCl.
C To classify the elements, we note that Sr lies well to the left of the diagonal belt of metalloids running from B to At; while Se and Cl lie to the right and Si lies in the middle. We can predict that Sr is a metal, Si is a metalloid, and Se and Cl are nonmetals.
Exercise \(\PageIndex{1}\)
On the basis of their positions in the periodic table, arrange Ge, N, O, Rb, and Zr in order of increasing electronegativity and classify each as a metal, a nonmetal, or a metalloid.
- Answer
-
Rb < Zr < Ge < N < O; metals (Rb, Zr); metalloid (Ge); nonmetal (N, O)
Number of Valence Electrons
One last trend that occurs on the periodic table is the trend of the number of valence electrons, which are the electrons that are farthest from the nucleus, and thus are the electrons that have the most energy, and that are involved in chemical reactions. For the A Group elements (IA-VIIIA), the the valence electrons are those electrons in the s and p subshells of the highest energy shell. Conveniently, the number of valence electrons for the A Group elements is equal to the group number. Thus, Na in Group IA has 1 valence electron, whereas C, in Group IVA has 4 valence electrons.
Summary
The arrangement of electrons in atoms allows us to understand many periodic trends. Covalent radius increases as we move down a group because the electrons are located in shells that are further from the nucleus. Covalent radius mostly decreases as we move left to right across a period because the electrons are pulled in more tightly to the nucleus. Ionization energy (IE, the energy associated with forming a cation) decreases down a group and mostly increases across a period because it is easier to remove an electron from a larger atom. Electron affinity (EA, the energy associated with forming an anion) has no simply-explained trends. Electronegativity (EN) is defined as the relative ability of an atom to attract electrons to itself in a chemical compound. Fluorine has been assigned the highest EN value and the EN values of other elements decrease the farther they are from fluorine.
Glossary
- covalent radius
- one-half the distance between the nuclei of two identical atoms when they are joined by a covalent bond
- effective nuclear charge
- charge that leads to the Coulomb force exerted by the nucleus on an electron, calculated as the nuclear charge minus shielding
- electron affinity
- energy required to add an electron to a gaseous atom to form an anion
- ionization energy
- energy required to remove an electron from a gaseous atom or ion. The associated number (e.g., second ionization energy) corresponds to the charge of the ion produced (X2+)
- isoelectronic
- group of ions or atoms that have identical electron configurations
Contributors
Paul Flowers (University of North Carolina - Pembroke), Klaus Theopold (University of Delaware) and Richard Langley (Stephen F. Austin State University) with contributing authors. Textbook content produced by OpenStax College is licensed under a Creative Commons Attribution License 4.0 license. Download for free at http://cnx.org/contents/85abf193-2bd...a7ac8df6@9.110).
- Modified by Tom Neils (Grand Rapids Community College)

