
TEM: Bright field versus dark field
- Page ID
- 143427
Student authors: Bobby Gaston 2018 & Han Le 2019
How bright field and dark field TEM are different
One of the main differences between the bright field and dark field mode is which electron populations are used to construct the TEM image. Bright field image is the most common image generated with a TEM. Some areas of the sample can absorb or scatter electrons and appear darker, while other areas that transmit electrons appear brighter. In the bright field image the unscattered (transmitted) electron beam is selected with the aperture, and the scattered electrons are blocked. Since the unscattered beam is selected, areas with crystalline or high mass materials will appear dark. On the other hand, in dark field mode, the unscattered electron beam is excluded from the aperture, and the scattered electrons are selected instead. Hence, the areas where there are no electron scattering and (e.g, the areas around the sample) will be black, while the areas with materials will appear bright. This technique can be used to enhance contrast when the bright field image is not clear enough, especially when imaging crystalline features that are too small or are drowned out of view. It can also be used to study the crystal lattice, crystal defects, stacking faults, dislocations and particle/grain size.
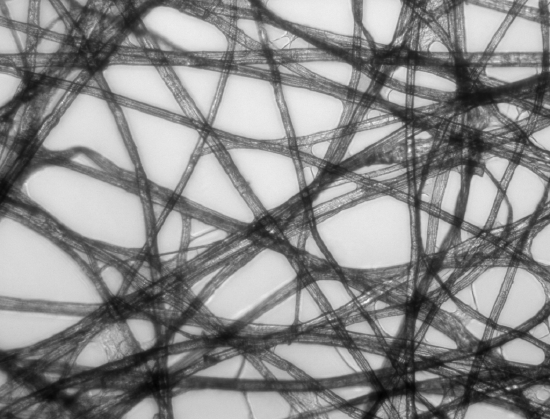
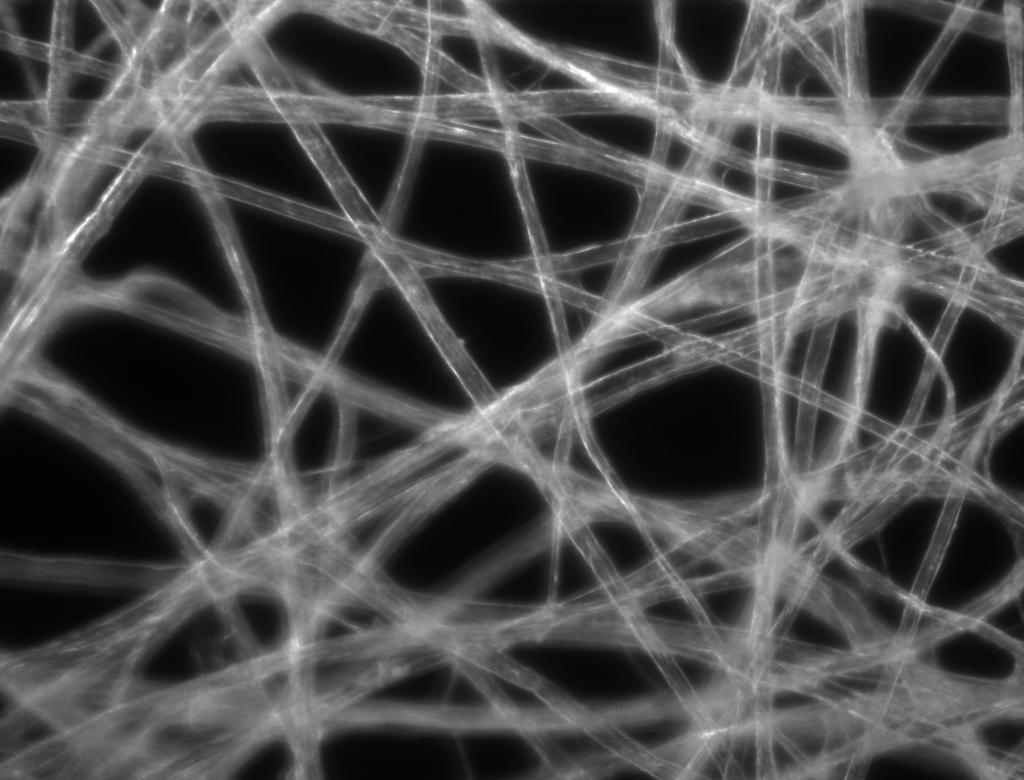
Figure \(\PageIndex{1}\): TEM image of a tissue paper sample in bright field mode (left) and dark field mode (right). Image author: Zephyris (Richard Wheeler, Wikipedia), used under Creative Commons Attribution-Share Alike 4.0 International license.
How to interpret the data
TEM dark field and light field image can be used to characterize the size and morphology of the sample as well as their crystal lattice. The most common sources of image contrast are particle mass and crystallinity. Heavier atoms scatter electrons more intensely than lighter atoms. Hence, in bright field mode, the regions with heavier atoms are darker, while in dark field mode these regions are brighter. In biological and polymeric samples with low atomic number, staining can help enhance the image contrast. Samples that are more crystalline are also more strongly diffracted and will appear darker in bright field mode, and brighter in dark field mode. The most common sources of error associated with TEM images are associated with aligning and positioning a sample. It is also important to note that the smaller the aperture size, the higher the contrast will be.
Good literature examples
- Truong, Q. D.; Devaraju, M. K.; Tomai, T.; Honma, I. ACS Applied Materials & Interfaces 2013, 5(20), 9926–9932.
Works cited
- https://en.Wikipedia.org/wiki/Transmission_electron_microscopy
- https://en.Wikipedia.org/wiki/Dark-field_microscopy
- Truong, Q. D.; Devaraju, M. K.; Tomai, T.; Honma, I. ACS Applied Materials & Interfaces 2013, 5(20), 9926–9932.
Useful resources for in-depth reading
- Klein, N. D.; Hurley, K. R.; Feng, Z. V.; Haynes, C. L. Analytical Chemistry 2015, 87(8), 4356–4362.
- Krivanek, O. L.; Chisholm, M. F.; Nicolosi, V.; Pennycook, T. J.; Corbin, G. J.; Dellby, N.; Murfitt, M. F.; Own, C. S.; Szilagyi, Z. S.; Oxley, M. P.; Pantelides, S. T.; Pennycook, S. J. Nature 2010, 464(7288), 571–574.
- Ayache, J.; Péchoux, C.; Jaillard, D.; Payré, B.; Pignot-Paintrand, I.; Cam, E. L. Macromolecular Symposia 2016, 361(1), 73–81.