
Energy-Dispersive X-ray Spectroscopy (EDS)
- Page ID
- 148440
Student authors: Bobby Gaston 2018 & Connor Protter 2019
What is EDS?
Energy-dispersive X-ray spectroscopy (also known as EDS, EDX, or EDXA) is a powerful technique that enables the user to analyze the elemental composition of a desired sample. The major operating principle that allows EDS to function is the capacity of high energy electromagnetic radiation (X-rays) to eject 'core' electrons (electrons that are not in the outermost shell) from an atom. This principle is known as Moseley's Law, which determined that there was a direct correlation between the frequency of light released and the atomic number of the atom.
Removing these electrons from the system will leave behind a hole that a higher energy electron can fill in, and it will release energy as it relaxes. The energy released during this relaxation process is unique to each element on the periodic table, and as such bombarding a sample with X-rays can be used to identify what elements are present, as well as what proportion they are present in.
Shown below is an example of how EDS works. The letters K, L, and M refer to the n value that electrons in that shell have (K electrons, closest to the nucleus, are n=1 electrons), while α and β indicate the size of the transition. The relaxation from M to L or L to K are therefore described as Lα or Kα, while going from M to K would be a Kβ transition. The means that are used for describing these processes as a whole are known as Siegbahn notation.

Figure Used under the Creative Commons Attribution Share Alike 3.0 License
How is data collected?
EDS functions with a series of three major parts: an emitter, a collector, and an analyzer. These parts are additionally typically equipped on an electron microscope such as SEM or TEM. The combination of these three pieces enables analysis of both how many X-rays are released, as well as what their energy is (in comparison to the energy of the initial X-rays that were emitted).
The EDS data is presented as a graph with KeV on the x-axis and peak intensity on the y-axis. The peak location on the x-axis are converted into the atoms that the energy changes represent by a computer program.

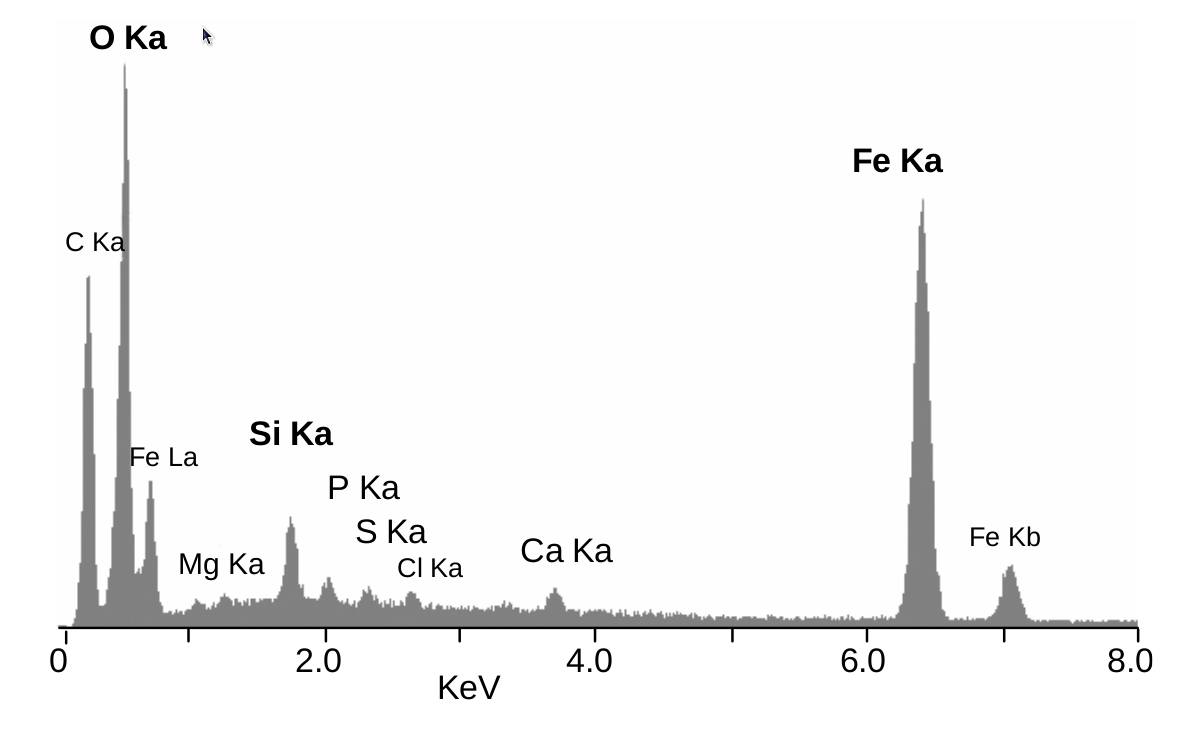
Figure. EDS chart from a research group that was analyzing the composition of shrimp and the associated bacteria that associate with these minerals. The EDS helped support the researcher's case that the endosymbiotic bacteria living on these shrimp actually do influence the iron oxide composition in these minerals. This is evident by the peaks at 0.5 and 6.5 KeV.2 Copyright of Cobari et. al and used under the Creative Commons Attribution 3.0 License.
What are some drawbacks of EDS?
Although EDS is an extremely useful technique, there are a number of difficulties involved with the process which hinder its utility. First, EDS is generally not a particularly sensitive technique. If the concentration of an element in the sample is too low, the amount of energy given off by X-rays after hitting the sample will be insufficient to adequately measure its proportion. Second, EDS generally does not work for elements with a low atomic number. Hydrogen and helium both only have an n=1 shell, meaning there aren't core electrons to be removed that can allow for X-ray emission. Lithium and beryllium, meanwhile, have sufficiently low atomic numbers that the energy of X-rays given off by Li or Be samples is insufficient for measurement, and often times they cannot be tested as a result.
One additional difficulty associated with the technique is the thickness of the sample. Sample thickness can bring energy levels closer together, thus making electrons easier to move to outer energy levels, which can in turn cause deviation in the results. Another error source is overlapping emitted x-rays, which can alter the KeV readings. Additionally, X-rays are not particularly effective at penetrating beyond several nanometers in samples, which means that only surface layers can be efficiently measured by the technique. As such, if there is a discrepancy between the outer and inner material layers, it will not necessarily appear in EDS.
Work Cited
- https://en.Wikipedia.org/wiki/Energy-dispersive_X-ray_spectroscopy
- https://cfamm.ucr.edu/documents/eds-intro.pdf
- https://myscope.training/legacy/anal.../quantitative/
- L. Corbari, M.-A. Cambon-Bonavita, G. J. Long, F. Grandjean, M. Zbinden, F. Gaill, and P. Compere "Iron oxide deposits associated with the ectosymbiotic bacteria in the hydrothermal vent shrimp Rimicaris exoculata" Biogeosciences 2008, 5, 1295–1310.