
X-ray diffraction (XRD) basics and application
- Page ID
- 148442
How the Technique Works
X-ray diffraction is a common technique that determine a sample's composition or crystalline structure. For larger crystals such as macromolecules and inorganic compounds, it can be used to determine the structure of atoms within the sample. If the crystal size is too small, it can determine sample composition, crystallinity, and phase purity. This technique sends x-ray beams through it. X-ray beams are chosen because their wavelength is similar to the spacing between atoms in the sample, so the angle of diffraction will be affected by the spacing of the atoms in the molecule, as opposed to using much larger wavelengths, which would be unaltered by the spacing between atoms. The x-rays then pass through the sample, “bouncing” off of the atoms in the structure, and changing the direction of the beam at some different angle, theta, from the original beam. This is the angle of diffraction. Some of these diffracted beams cancel each other out, but if the beams have similar wavelengths, then constructive interference occurs. Constructive interference is when the x-ray beams that are whole number integers of the same wavelength add together to create a new beam with a higher amplitude. The greater amplitude of the wave translates into a greater signal for this specific angle of diffraction. The angle of diffraction can then be used to determine the difference between atomic planes using Bragg’s law, \(sin Θ = nλ / 2d\) where lambda is the wavelength added, theta is the angle of diffraction, and d is the distance between atomic planes. The distance between atomic plates can then be used to determine composition or crystalline structure.
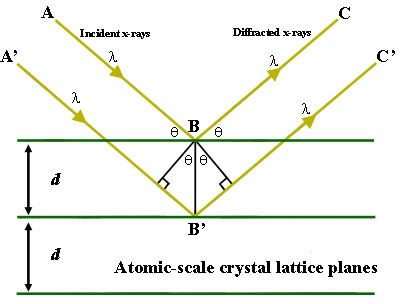
Figure 1. Bragg's Law reflection. The diffracted X-rays exhibit constructive interference when the distance between paths ABC and A'B'C' differs by an integer number of wavelengths (λ). Figure Courtesy of Creative Commons license and found on https://serc. carleton. edu/msu_nanotech/methods/BraggsLaw. html
Useful Visualization of X-ray Diffraction
How to interpret the data
The result of X-ray diffraction plots the intensity of the signal for various angles of diffraction at their respective two theta positions. The two theta positions correspond to a certain spacing between the crystals or atoms in the samples, determined by the angle of diffraction from the incident x-ray beam sent into the sample. The intensity of the peaks is related to the amount of molecules in that phase or with that spacing. The greater the intensity of the peak, the greater the amount of crystals or molecules with that distinct spacing.
The width of the peaks is inversely proportional to the crystal size. A thinner peak corresponds to a bigger crystal. A broader peak means that there may be a smaller crystal, defect in the crystalline structure, or that the sample might be amorphous in nature, a solid lacking perfect crystallinity. For smaller samples, the patterns determined using XRD analysis can be used to determine a sample’s composition. There is a large database of elements, compounds, and minerals that contain the diffraction patterns for elements, compounds, and minerals. The pattern for an unknown compound can be compared to the literature and experimentally determined values to verify the identity of an element, matching both the location, width, and relative heights of the diffraction patterns.
Figure "2" Figure courtesy of Creative Commons license and can be found at https://serc. carleton. edu/details/images/20376. html
Good literature examples
Works cited
- X-ray Diffraction @ McGill http://eps. mcgill. ca/xrd/howxrdworks. html (accessed May 3, 2019).
- BraggsLaw https://serc. carleton. edu/msu_nanote. . . BraggsLaw. html (accessed May 3, 2019).
- DoITPoMS - TLP Library X-ray Diffraction Techniques - Relationship between crystalline structure and X-ray data https://www. doitpoms. ac. uk/tlplib/xr. . . ction/peak. php (accessed May 3, 2019).
- Diffraction Basics | Chemical Instrumentation Facility | Iowa State University https://www. cif. iastate. edu/acide/xrd-tutorial/xrd (accessed May 3, 2019)