
WAXS and SAXS
- Page ID
- 148694
Student authors: Katie Kidder 2018 & Xueying Lyu 2019
WAXS (Wide-angle X ray scattering):
In X-ray crystallography, is the analysis of Bragg peaks scattered to wide angles, which are caused by sub-nanometer sized structure. It is used to determine the crystalline structure of the polymers. The diffraction pattern can be used to determine the chemical composition or phase of the films, and the size or texture of the films. Wide-angle X-ray scattering is the same technique as Small-angle X-ray Scattering (SAXS), except that the distance from sample to the detector is shorter and thus diffraction maxima at larger angles are observed for WAXS.
How does the technique work?
The sample is scanned in a wide-angle X-ray goniometer. A goniometer is an instrument that either measures the angles or allows an object to be rotated to a precise angle. X-rays are scattered by the electrons in a material. The scattering intensity is plotted as a function of the 2θ angle. WAXS usually covers angular 5-60 degree. For SAXS, it covers much smaller angle, which is up to 1 degree.
When X-rays are directed at the solids, they are scattered in some certain patterns depend on the internal structure of the material. A crystalline solid can consist of regularly spaced atoms (electrons) that are referred as imaginary planes. The distance between the imaginary planes is called d-spacing. The intensity of the d-spacing is proportional to the number of electrons/atoms in the structure. Since every crystal solid as its unique pattern of d-spacing (powder pattern) , the chemical characteristics can be determined.

Figure 1. Wide-angle scattering set up. FR.F. Fischetti et al, The BioCAT undulator beamline 18ID: a facility for biological non‐crystalline diffraction and X‐ray absorption spectroscopy at the Advanced Photon Source (2004) J. Synch. Rad. 11:399 – 405.
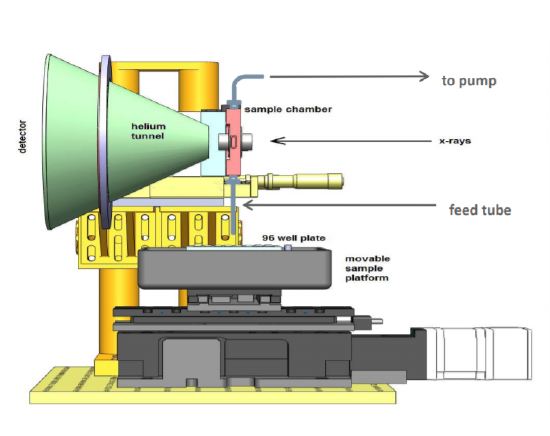
Figure 2. Portable WAXS set up with sample autolader.
How to interpret the data?
The position of the peak from WAXS spectra can indicate the presence of certain structure.
For example, the peaks in WAXS spectra (Figure 3 ) indicates the composition of the protein myoglobin (black) and hemoglobin (red).
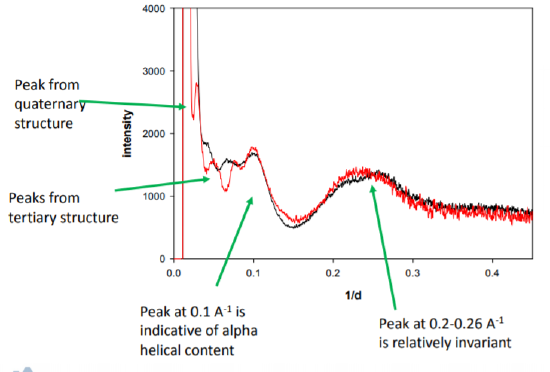
Figure 3. The WAXS spectra of myoglobin (black) and hemoglobin (red).
Good Literature Example:
G. A. Waychunas, C. C. Fuller, B.A, Rea, J.A. Davis, “Wide angle X-ray scattering (WAXS) study of "two-line" ferrihydrite structure: Effect of arsensate sorption and counterion variation and comparison with EXAFS results”, Geochimica et cosmochimica Acta, 1996, 60, 1765-1782.
Reference:
https://en.Wikipedia.org/wiki/Wide-angle_X-ray_scattering
https://www.malvernpanalytical.com/en/products/technology/xray-scattering
https://www.embl-hamburg.de/biosaxs/courses/embo2012/slides/high-brilliance-waxs-fischetti.pdf
https://www.diamond.ac.uk/Science/Research/Techniques/Diffraction/Scattering.html