13.2: How to Dock Your Own Drug
- Page ID
- 255664
Molecular Docking Experiments
This tutorial explains how to perform molecular docking experiments using Autodock Vina (molecular docking software) and UCSF Chimera (molecular visualization software), both of which are freely available for academic users. In this tutorial, we will use the 3-D structure of muscle glycogen phosphorylase from rabbit (PDB ID: 1c8k) as a target macromolecule template and three ligand molecules (stored in the files generated using the jupyter notebook for Chapter 7 (lecture07-virtual-screening_v0.ipynb)).
Step 0: Installation of Autodock Vina and Chimera
(0-A) Download Autodock Vina (http://vina.scripps.edu/download.html) and install it on your computer.
(0-B) Download UCSF Chimera (http://www.cgl.ucsf.edu/chimera/download.html) and install it on your computer.
· For both programs, make sure that you download a correct version, depending on the operation system of your computer (Windows, Mac, or Linux) and whether it is 64-bit or 32-bit.)
(0-C) Read the tutorial “UCSF Chimera – Getting Started“ (https://www.cgl.ucsf.edu/Outreach/Tutorials/GettingStarted.html) to learn how to use chimera. Other tutorials are also available at https://www.cgl.ucsf.edu/chimera/tutorials.html.
(0-D) Watch this YouTube video (https://www.youtube.com/watch?v=cLGQ-951FDk). This video explains how to perform a docking experiment using Autodock Vina and Chimera.
Step 1: Loading the 3-D structure of the co-crystallized target-ligand complex.
(1A) Open Chimera.
(1B) Select “FILE” --> “Fetch by ID” --> “PDB”, provide the PDB ID (“1c8k”), and click “Fetch” at the bottom. This will load the 3-D structure of “1c8k”.
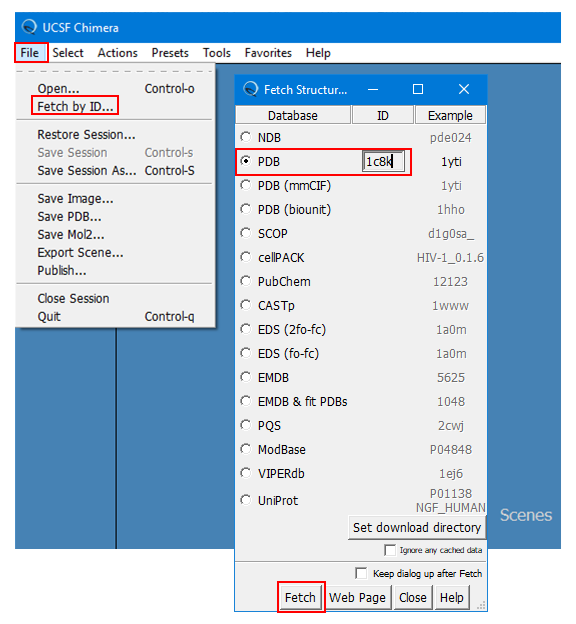
(1C) Save this structure as “pygm_1c8k.pdb” (for your reference) by selecting “FILE” --> “Save PDB …” and providing the filename. [Here, “pygm” is the symbol of the gene that encodes the target protein (glycogen phosphorylase, muscle associated).]
Step 2: Prepare a ligand structure for docking, using the inhibitor co-crystallized with the target in 1c8k. This docking example will allow us to compare a predicted pose of the inhibitor with the experimental pose. Note that the 1c8k protein-ligand complex has two small molecules bound to the target protein. We need to figure out which one is the inhibitor.
(2A) Review the ligand information for PDB ID 1c8k, available at: https://www.rcsb.org/structure/1C8K. This protein-ligand complex has two small molecules bound to the protein: Flavopyridol (CPB) and Vitamin B6 Phosphate (PLP). According to the abstract available on this page, CPB is an inhibitor and PLP is a substrate of the protein. In this docking experiment, we will dock ligands to the inhibition site of the protein.
(2B) Investigate the structure of the inhibition site. Five amino acid residues with close contacts to the CPB ligand are already shown by default. Place the mouse pointer on each of these residues and record their names and IDs. (For example, PHE285, GLU382, …)
(2C) Delete all residues and ligand/water molecules, except for CPB. This can be done by selecting:
(2C-1) Select --> Residue --> CPB
(2C-2) Select --> Invert (all models)
(2C-3) Actions --> Atoms/Bonds --> Delete
(2D) Save the ligand molecule by following these steps:
(2D-1) select File --> Save PDB…
(2D-2) provide the file name “pygm_1c8k_cpb”
(2D-3) uncheck “Use untransformed coordinates”
(2D-4) press “Save”
(2E) Close the current session by selecting: File --> Close session.
Step 3: Prepare a protein structure for docking.
(3A) Load the 1c8k structure [in the same way as Step (1A)-(1B)].
(3B) Delete all ligand/water molecules, except for protein. This can be done by selecting:
(3B-1) Select --> Structure --> Protein
(3B-2) Select --> Invert (all models)
(3B-3) Actions --> Atoms/Bonds --> Delete
(3C) Save the protein structure by following these steps:
(3C-1) select File --> Save PDB…
(3C-2) provide the file name “pygm_1c8k_protein.pdb”
(3C-3) uncheck “Use untransformed coordinates”
(3C-4) press “Save”
NOTE: DO NOT CLOSE THE CURRENT SESSION NOW. WE WILL USE THIS PROTEIN STRUCTURE TO SET UP THE DOCKING EXPERIMENT.
Step 4: Set up a molecular docking experiment.
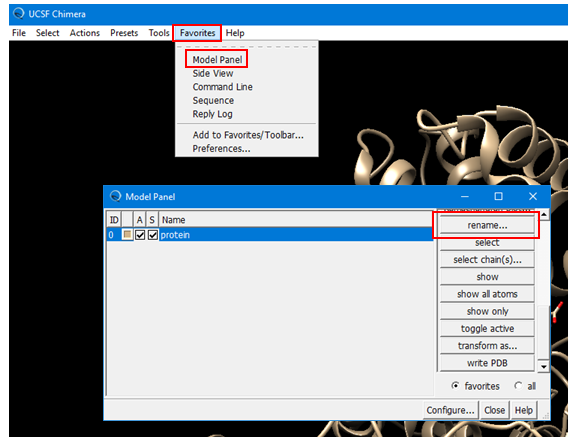
(4A) Open the Model Panel by selecting: Favorites --> Model Panel (Alternatively, Tools --> General Controls --> Model Panel.) Rename the existing protein structure to “protein”.
(4B) Create a named selection for the inhibition site, using the residue names/IDs from Step 2B.
(4B-1) Open the Sequence window by choosing: Tools --> Sequence --> Sequence and then choosing “protein”, which will be used as a template for docking experiments.

(4B-2) Select the five residues identified in Step 2B. When the mouse point is placed on a residue, their symbol and ID will be shown at the right-bottom of the windown (e.g., ILE 584). Use “control+drag” to add new region and “shift+drag” to add to region. Selected residues will be highlighted in green.
(4B-3) Go to the main Chimera window and choose: Select --> Name selection and provide “inhibition_site” as an alias for the five selected residues. After naming this selection, “inhibition_site” will be listed under the “Named Selections”. This will be used later to display the inhibition site.

(4C) Without closing the current session (which has the protein structure), open the ligand file prepared in Step 2 (“pygm_1c8k_cpb.pdb”).
(4D) Check the location of the ligand by using the “Model Panel”, which can be accessed by selecting: Favorites --> Model Panel (alternatively, by selecting: Tools --> General Controls --> Model Panel. Note that the ligand is not necessarily positioned at the binding pocket (because the “Use untransformed coordinates” box was unchecked when the ligand was saved). Rename the ligand as “ligand_cpb”.
(4E) Open the Autodock Vina window by selecting: Tools --> Surface/Binding Analysis --> Autodock Vina.
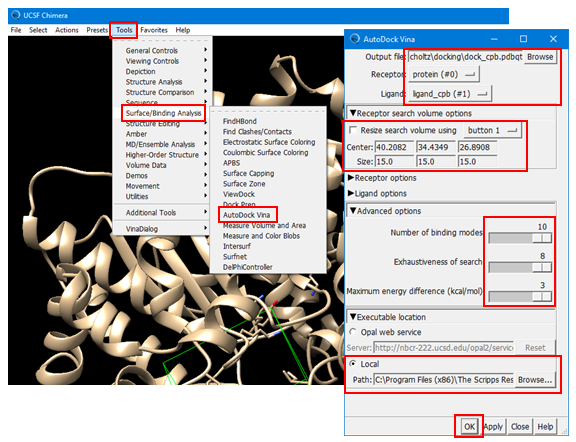
(4E-1) Set the output file name to “dock_cpb.pdbqt”. [Note that the file extension is “pdbqt”].
(4E-2) Select “protein” as the receptor and “ligand_cpb” as the ligand.
(4E-3) Define the simulator box using the “Receptor Search Box Options”. This box defines the location of the binding site for the ligand and it tells the docking program where it should search to predict the best binding pose of the ligand. Once you check the box for “Resize search volume using Button X” (where X can be 1, 2, or 3 or Ctrl+1, Ctrl+2, Ctrl3, depending on your machine), you can draw, move, resize the simulator box. [To resize the box, you need to click and drag one of the faces of the box while holding down the left mouse button]. Make sure that all residues to which the CPB ligand was bound should be contained in the simulator box. If you have difficulty in setting up the box, use the following numbers:
Center: 40.2082, 34.4349, 26.8908
Size: 15.00, 15.00, 15.00
[These numbers were used to get the docking results shown in the images included in this tutorial.]
(4E-4) Select “Advanced Option” and adjust the parameters to the largest possible values.
· 10 for Number of binding mode
· 8 for Exhaustiveness of search
· 3 for maximum energy difference (kcal/mol)
In this exercise, we are testing only a few ligands, which does not take too much computational resources, so it is okay to adjust these parameters to the maximum possible values. However, if you are performing a large-scale screening, they need to be adjusted accordingly.
(4E-5) Select “Executable Location” and then “Local” and provide the path of the “vina.exe” installed on you PC. It should be something similar to:
C:\Program Files (x86)\The Scripps Research Institute\Vina\vina.exe
(4E-6) Press “OK” to start the docking experiment. This will take a few minutes, depending on your machine. You may encounter some warning messages, but the computation will continue until it finds the requested number of poses.
(4E-7) Once the docking experiment is done, the View Dock window will be presented, which shows the list of poses predicted, along with additional information.
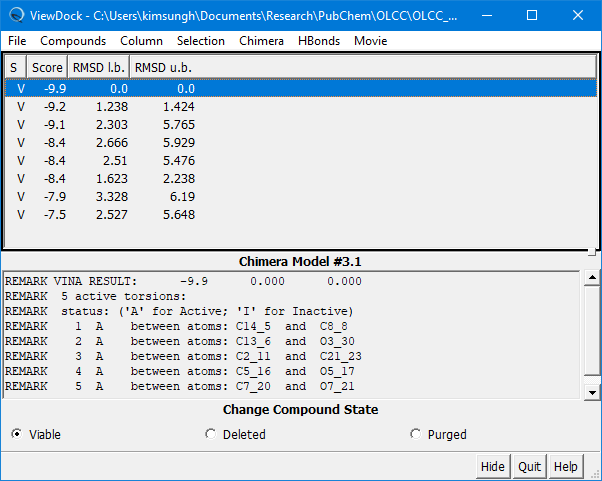
Step 5: Review the docking results
(5A) Look into the 10 predicted poses by selecting them from the ViewDock window.
(5B) Overlap the experimentally determined pose with the best predicted pose by opening the structure of PDB 1c8k [see Step (1B)].
(5C) Show only the CPB ligands (from the docking and the PDB), by taking these steps:
(5C-1) Select --> Residue --> CPB
(5C-2) Select --> Invert (all models)
(5C-3) Actions --> Atoms/Bonds --> Hide
(5C-4) Actions --> Ribbon --> Hide
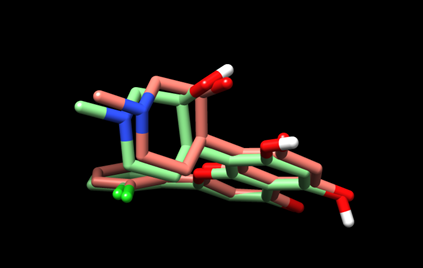
The resulting view will be similar to this:
Here, the predicted pose is in green and the experimental pose is in red.
(5D) Save the current view as “dock_cpb_img.png” by selecting File --> Save Image… and providing the file name.
(5E) Show the protein and other ligands that were hidden for image generation [in (5C)-(5D)], by taking these steps:
(5E-1) Select --> Structure --> Protein
(5E-2) Actions --> Ribbon --> Show
(5E-3) Select --> “Clear Selection”.
Step 6: Now dock one of the ligand molecules returned from the jupyter notebook.
(6A) Open the file containing the hit compound with the highest rank (pygm_lig0_11779854.mol).
(6B) Check the location of the ligand using the Model Panel [see Step (4A)] and rename the ligand as “ligand0”.
(6C) Perform the docking experiment using “ligand0”, in the similar manner to Step (4E).
· Make sure that the output file should be set differently from the previous one in order not to overwrite the previous data. (For example, set the output file name “dock_ligand0.pdbqt”.
· Make sure that “ligand0” is selected as the ligand.
· Use the same simulator box location and size.
· Use the same values for other parameters.
Note: the ligands contained the .mol files are already energy-minimized and ready for docking. However, if a ligand does not have a 3-D structure (e.g., only the 2-D structure or SMILES string is available), a reasonable 3-D structure should be generated using the “Minimize Structure” and “Dock Prep” tools in Chimera.
(6D) Visualize the binding pose
(6D-1) Hide the protein structure by doing:
· Select --> Structure --> Protein, and
· Actions --> Ribbon --> Hide
(6D-2) Show only the residues at the binding site by doing:
· Select --> Named Selections --> inhibition_site
· Actions --> Atoms/Bonds --> Show
· Actions --> Ribbon --> Show
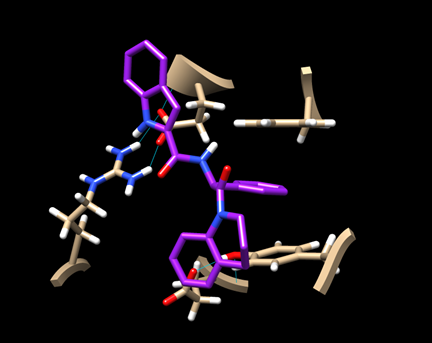
(6D-3) Now you have a view similar to this:
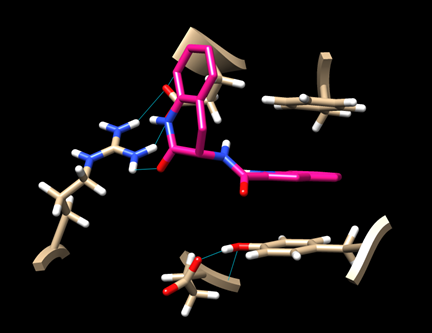
An aromatic ring of the ligand is stacked with the rings of TYR 163 and PHE 285, indicating some hydrophobic interaction. There is also a hydrogen bond between the ligand and ARG 770.
Save this image as “dock_ligand0_img.png”.
Step 7: For the remaining two ligands, repeat the docking experiment and generate the image of their best binding poses.
· dock_ligand1_img.png (for pygm_lig1_118078858.mol)
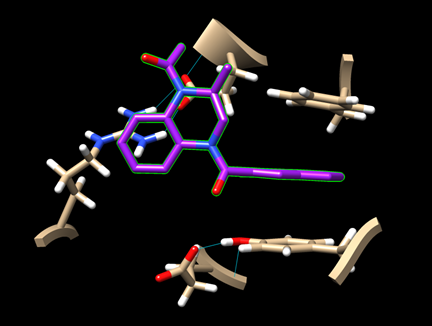
· dock_ligand2_img.png (for pygm_lig2_53013349.mol)