
1.2.3.4.1: Quantitative Measures of Hardness, Softness, and Acid-Base Interactions from a Hard Soft Acid-Base Principle perspective involve orbital energies and or apportioning acid-base bonding in terms of electrostatic and covalent factors
- Page ID
- 360791
Pearson Absolute Hardness is a useful metric of hardness based on orbital energies
The recognition that hard acids and bases possess a large HOMO-LUMO gap suggests that the gap size itself might serve as a useful index of hardness. The basis for this idea may be found by considering Pearson’s definition of absolute hardness, η.1 Pearson's absolute hardness, η, is half the second derivative of a species' energy with respect to changes in total number of electrons, \(N_{e^-}\).
\[\text{Pearson’s absolute hardness} = η = \dfrac{1}{2} \dfrac{d^2 E}{dN_{e^-}^2} \nonumber \]
\((in~~eV)\)
and, since acids' and bases’ hardness and softness are inversely related, Pearson’s absolute softness, σ, is just the inverse of hardness.
\[\text{Pearson’s softness} = \dfrac{1}{ η} \nonumber \]
Of these, Pearson’s absolute hardness is related to the Mulliken definition of electronegativity as the first derivative of a species' energy with respect to changes in total number of electrons.
\[\text{Mulliken electronegativity} = χ = \dfrac{d E}{dN_{e^-}} \nonumber \]
\((in~~eV)\)
Operationally, both the Pearson hardness and Mulliken electronegativity are approximated in terms of the energies associated with unit changes in the number of electrons – i.e., in terms of ionization energies and electronegativities. Specifically,
\[\text{Pearson’s absolute hardness} = η ≈ \dfrac{IE – EA}{2} \nonumber \]
\[\text{Mulliken electronegativity} = χ ≈ \dfrac{IE + EA}{2} \nonumber \]
where \(IE\) and \(EA\) are in \(eV\).
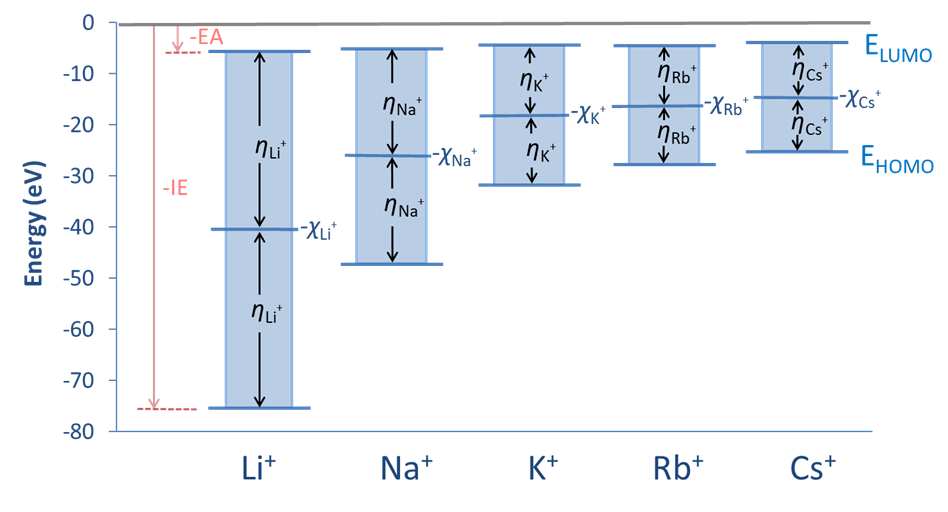
The connection between Pearson’s absolute hardness/softness and the HOMO-LUMO gap then follows from Koopman’s theorem, in which the ionization energy (IE) is just the opposite of the HOMO energy.
\[IE = -E_{HOMO} \nonumber \]
Similarly, the electron affinity (EA), defined as the opposite of the energy released on absorption of an electron, may be taken as an approximation of the LUMO energy.
\[E_{LUMO} ≈ -EA \nonumber \]
So Pearson’s absolute hardness is just half the HOMO-LUMO gap (band gap) size in electron volts:
\[\text{Pearson's absolute hardness} = η ≈ \dfrac{E_{LUMO} – E_{HOMO}}{2} \nonumber \]
where all values are given in \(eV\),
and the Mulliken electronegativity is just the average of the HOMO and LUMO energies (~Fermi energy):
\[Mulliken~electronegativity, χ ≈ -\dfrac{E_{LUMO} + E_{HOMO}}{2} \nonumber \]
\(where~all~values~are~given~in~eV\)
The relationships between the Pearson absolute hardness, Mulliken electronegativity, and HOMO and LUMO energies are depicted schematically for the group 1A monocations in Figure \(\PageIndex{1}\).
Values of the Pearson hardness and Mulliken electronegativity for several acids and bases are given in Table \(\PageIndex{1}\). The values in the table confirm the expected trends, showing an increase in hardness with size (down a group), with increasing charge, and as substituent electronegativity increases for a series of isolobal ions.
| Species | Ionization Energy, IE or I (eV) | Electron Affinity, EA or A (eV) | Mulliken Electronegativity, χ (eV) | Pearson Absolute Hardness, η (eV) |
|---|---|---|---|---|
| Selected Acids | ||||
| Group 1A monocations | ||||
| Li+ | 75.64 | 5.39 | 40.52 | 35.12 |
| Na+ | 47.29 | 5.14 | 26.21 | 21.08 |
| K+ | 31.63 | 4.34 | 17.99 | 13.64 |
| Rb+ | 27.28 | 4.18 | 15.77 | 11.55 |
| Cs+ | 25.1 | 3.89 | 14.5 | 10.6 |
| Group 11 monocations | ||||
| Cu+ | 20.29 | 7.73 | 14.01 | 6.28 |
| Ag+ | 21.49 | 7.58 | 14.53 | 6.96 |
| Au+ | 20.5 | 9.23 | 14.9 | 5.6 |
| Isoelectronic Row 3 Metal Cations | ||||
| Na+ | 47.29 | 5.14 | 26.21 | 21.08 |
| Mg2+ | 80.14 | 15.04 | 47.59 | 32.55 |
| Al3+ | 119.99 | 28.45 | 74.22 | 45.77 |
| Changes with Transition Metal Ion Charge | ||||
| Fe2+ | 30.65 | 16.18 | 23.42 | 7.24 |
| Fe3+ | 54.8 | 30.65 | 42.73 | 12.08 |
| Co2+ | 33.50 | 17.06 | 25.28 | 8.22 |
| Co3+ | 51.3 | 22.5 | 42.4 | 8.9 |
| Boron trihalides | ||||
| BF3 | 15.81 | -3.5 | 6.2 | 9.7 |
| BCl3 | 11.60 | 0.33 | 5.97 | 5.64 |
| BBr3 | 10.51 | 0.82 | 5.67 | 4.85 |
| CO2 | 13.8 | -3.8 | 5.0 | 8.8 |
| CS2 | 10.08 | 0.62 | 5.35 | 5.56 |
| Selected Bases | ||||
| Group 17 monoanions (taken to be identical to the free atom values; for arguments as to why this is reasonable see Pearson, R. G., Inorg. Chem. 1988, 27 (4), 734-740.) | ||||
| F- | 17.42 | 3.40 | 10.41 | 7.01 |
| Cl- | 13.01 | 3.62 | 8.31 | 4.70 |
| Br- | 11.84 | 3.36 | 7.60 | 4.24 |
| I- | 10.45 | 3.06 | 6.76 | 3.70 |
| Group 15 hydrides | ||||
| NH3 | 10.7 | -5.6 | 2.6 | 8.2 |
| PH3 | 10.0 | -1.9 | 4.1 | 6.0 |
| Trimethylpnictides | ||||
| NMe3 | 7.8 | -4.8 | 1.5 | 6.3 |
| PMe3 | 8.6 | -3.1 | 2.8 | 5.9 |
| AsMe3 | 8.7 | -2.7 | 3.0 | 5.7 |
| Group 16 hydrides | ||||
| H2O | 12.6 | -6.4 | 3.1 | 9.5 |
| H2S | 10.5 | -2.1 | 4.2 | 6.2 |
| Phosphorous trihalides | ||||
| PF3 | 12.3 | -1.0 | 5.7 | 6.7 |
| PC13 | 10.2 | 0.8 | 5.5 | 4.7 |
| PBr3 | 9.9 | 1.6 | 5.6 | 4.2 |
Drago-Wayland Acid-Base Parameters allow for estimation of the electrostatic and covalent contributions to the enthalpy of formation of a Lewis acid-base adduct.
Although Pearson hardness values are a useful metric of acids' and bases' hardness, they cannot easily be used to estimate the Lewis acid-base interaction energy. This is not the case for the EC model developed by Drago and Wayland.3 In the Drago and Wayland's EC Model, the enthalpy of formation of an acid-base adduct, AB,
\[A + B ⇌ AB ~~~~~~\Delta H_{AB~adduct} \nonumber \]
from the acid (A) and base (B) can be calculated as the sum of products of electrostatic (E) and covalent (C) factors that reflect the propensity of the acid and base to engage in strong electrostatic and covalent interactions with one another:
\[-\Delta H_{AB~adduct} = E_AE_B + C_AC_B \nonumber \]
where EA and CA are the electrostatic and covalent parameters for the acid and EB and CB the electrostatic and covalent parameters for the base given in units of kcal½ mol-½. E and C parameters for selected acids and bases are given in Table \(\PageIndex{2}\) .
| Species | E (kcal½ mol-½) | C (kcal½ mol-½) | W (kcal mol-1) | C/E |
|---|---|---|---|---|
| Acids | ||||
| I2 | 0.5† | 2† | 0 | 4 |
| ICl | 2.92 | 1.66 | 0 | 0.57 |
| H2O | 1.31 | 0.78 | 0 | 0.59 |
| SO2 | 0.51 | 1.56 | 0 | 3.1 |
| HCCl3 (chloroform) | 1.56 | 0.44 | 0 | 0.28 |
| (CH3)3COH | 1.07 | 0.69 | 0 | 0.65 |
| (CF3)3COH | 3.06 | 1.88 | -0.87 | 0.61 |
 |
2.27 | 1.07 | 0 | 0.47 |
 |
2.23 | 1.03 | 0 | 0.46 |
 |
2.30 | 1.11 | 0 | 0.48 |
 |
1.38 | 0.68 | 0 | 0.49 |
| BF3 | 1.62 | 9.88 | 6.10 | |
| B(CH3)3 | 2.90 | 3.60 | 0 | 1.2 |
| Al(CH3)3 | 8.66 | 3.68 | 0 | 0.43 |
| Ga(C2H5)3 | 6.95 | 1.48 | 0 | 0.21 |
| In(CH3)3 | 6.60 | 2.15 | 0 | 0.33 |
| Zn[N(Si(CH3)3)]2 | 2.75 | 2.32 | 0 | 0.84 |
| Cd[N(Si(CH3)3)]2 | 2.50 | 1.83 | 0 | 0.73 |
| Bases | ||||
| NH3 | 2.31 | 2.04 | 0.88 | |
| CH3NH2 | 2.16 | 3.13 | 1.4 | |
| (CH3)2NH | 1.80 | 4.21 | 2.3 | |
| (CH3)3N | 1.21 | 5.61 | 4.6 | |
 |
1.78 | 3.54 | 2.0 | |
 |
1.81 | 3.73 | 2.0 | |
 |
1.53 | 2.94 | 1.9 | |
| CH3CN | 1.64 | 0.71 | 0.43 | |
| ClCH2CN | 1.67 | 0.33 | 0.20 | |
| CH3C(O)CH3 | 1.74 | 1.26 | 0.72 | |
| (C2H5)2O | 1.80 | 1.63 | 0.91 | |
 |
1.64 | 2.18 | 1.3 | |
 (EtOAc) (EtOAc) |
1.63 | 0.95 | 0.58 | |
 |
2.35† | 1.31 | 0.56 | |
| (CH3)2S | 0.25 | 3.75 | 15 | |
| (CH3CH2)2S | 0.24 | 3.92† | 15 | |
 |
0.26 | 4.07 | 16 | |
| (CH3)2Se | 0.05 | 4.24 | 83 | |
| (CH3)2SO | 2.4 | 1.47 | 0.61 | |
| (CH3)3P | 0.25 | 5.81 | 24 | |
| (CH3O)3P | 0.13 | 4.83 | 37 | |
| (C6H5)3PO | 2.59 | 1.67 | 0.64 | |
| (C6H5)3PS | 0.35 | 3.65 | 10 | |
| C6H6 | 0.70 | 0.45 | 0.64 | |
† These values were fixed to parameterize the rest of the E and C parameters.
Trends in the relative values of C and E for the acids and bases in Table \(\PageIndex{2}\) are very roughly consistent with the trends in hardness and softness outlined earlier. However, the parameters suggest that some trends in hardness reflect changes in species' ability to engage in ionic interactions while others reflect changes in species' ability to engage in strong covalent interactions. For example, CB for the dimethylchalcogenides increases steadily from 1.5 to 4.25 kcal½ mol-½ on going from Me2O to Me2Se while EB decreases from 1.68 to 0.05 kcal½ mol-½, suggesting that electrostatic and covalent factors are both involved in a decrease in base hardness down group 16. However, in the case of phosphines and amines it appears that electrostatic factors are primarily responsible for the decrease in hardness down group 15. On going from Me3N to Me3P, CB only increases slightly from 5.61 to 5.81 kcal½ mol-½ while EB decreases from 1.21 to 0.25 kcal½ mol-½ - i.e., to 20% of the Me3N value.
However, some species tend to have very high values for both E and C, reflecting their ability to engage in strong electrostatic and covalent interactions, while others have small values for both, reflecting their relative stability as free species in solution.
As can be seen by comparing the acids and bases listed in the absolute hardness table (Table \(\PageIndex{1}\)) and the EC parameters table (Table \(\PageIndex{2}\)). The EC model has primarily been applied to organic and main group organometallic acids and bases. However, a variety of extensions have been proposed that enable its wider applicability.
The simple EC model only includes electrostatic and covalent considerations and thus ignores steric, lattice energy, and other contributions to the interaction energy. Thus it is only useful for analyzing the interaction energies of sterically unhindered adducts in which solvation energy and other contributions to the overall interaction energy are insignificant. However, additional refinements of the model attempt to extend its usefulness by accomodating various factors, such as
- Steric strain. Specifically, Hancock and Martell6 introduced a D parameter to account for any additional steric strain introduced upon adduct formation,* giving
\[-\Delta H_{AB~adduct} = E_AE_B + C_AC_B - D_AD_B \nonumber \]
- Charge transfer upon adduct formation. As discussed in section 6.4.2, the formation of a Lewis acid-base complex results in a net transfer of electron density from the electron donor (base) to the acceptor (acid). Drago and Wong7 extended the EC model to include that charge transfer by adding what they called receptance factors that account for the acid's ability to receive electron density (RA) and transference factors that account for the base's ability to donate electron density (TB), giving
\[-\Delta H_{AB~adduct} = E_AE_B + C_AC_B + R_AT_B \nonumber \]
This extension of the EC model is called the electrostatic-covalent-transfer or ECT model. Notably, it has been applied successfully to adducts involving ions, for which the RATB term can account for as much as 31% of the interaction energy.
- Any constant energy term, such as the energy needed to cleave a dimer in order to make the Lewis acid (e.g., Al2Cl6 → 2AlCl3). Drago and Vogel4 extended the EC model to accommodate these constant energy terms, which they designated W. The resulting model is called the ECW model, for which
\[-∆H_{AB~adduct} = E_AE_B + C_AC_B + W \nonumber \]
where
\[W = W_A + W_B \nonumber \]
A simple application of EC and extended EC models is that they allow the enthalpy of adduct formation to be calculated. These enthalpy calculations based on the EC model are consistent with the superior interaction energy of hard-hard and soft-soft interactions compared to hard-soft ones. Consider, for example, the transfer of I2 between BF3 and InMe3, H3N-BF3, and H3N-InMe3.
\[H_3N-BF_3 + InMe_3 ⇌ BF_3 + H_3N-InMe_3 \nonumber \]
Since H3N is a hard base and BF3 and InMe3 are harder and softer acids, respectively, the equilibrium is expected to favor the reactant, H3N-BF3. Assuming the equilbrium is enthalpically driven, this qualitative analysis is consistent with the expected endothermic enthalpy of the reaction, as may be seen from the calculated enthalpies of adduct formation for both H3N-BF3 and H3N-InMe3.
For H3N-BF3:
\[-\Delta H_{H_3N-BF_3} = E_{BF_3}E_{NH_3} + C_{BF_3}C_{NH_3} \nonumber \]
\[-\Delta H_{H_3N-BF_3} = (1.62)(2.31) + (9.88)(2.04) \nonumber \]
\[-∆H_{H_3N-BF_3} = 3.74~kcal/mol + 20.1~kcal/mol = 23.8~kcal/mol \nonumber \]
\[∆H_{H_3N-BF_3} = -23.8~kcal/mol \nonumber \]
For H3N-InMe3:
\[-∆H_{H_3N-InMe_3} = E_{InMe_3}E_{NH_3} + C_{InMe_3}C_{NH_3} \nonumber \]
\[-∆H_{H_3N-InMe_3} = (6.6)(2.31) + (2.15)(2.04) \nonumber \]
\[-∆H_{H_3N-InMe_3} = 15.25~kcal/mol + 4.39~kcal/mol = 19.63~kcal/mol \nonumber \]
\[∆H_{H_3N-InMe_3} = -19.63~kcal/mol \nonumber \]
So H3N-BF3 is enthalpically favored by -4.2 kcal/mol [=-23.8 kcal/mol - (-19.63 kcal/mol) according to Hess' Law].
In addition to their utility for estimating enthalpies of Lewis acid-base complex formation, EC and related models serve as a useful tool for estimating the relative importance of ionic, covalent, and steric factors in complex formation. Specifically,
- The relative contributions of ionic and covalent factors can be calculated directly, as from the E and C terms. This can provide insight into why some complexes are more stable than others. Such calculations reveal that the hard-hard adduct H3N-BF3 is favored over the hard-soft adduct H3N-InMe3 because of the strong covalent interaction holding together H3N-BF3. The covalent term accounts for 84% of the energy of the H3N-BF3 interaction and is largely lost upon formation of H3N-InMe3, for which it contributes only 22% of the interaction energy. When the electrostatic term is accounted for, it can be seen that the formation of H3N-InMe3 from H3N-BF3 is disfavored, since it would result in a loss of 15.7 kcal/mol of covalent stabilization that would be incompletely compensated for by a gain of 11.5 kcal/mol of electrostatic stabilization.
- The role of other contributions to the bonding in a Lewis acid-base complex may be estimated from the discrepancy between the experimental and EC model calculated stabilization energies. This is because the EC parameters assume sigma bonding and so any deviation between the calculated and experimental enthalpies of complex formation can be attributed to non-sigma contributions.
- This is done explicitly in extensions of the EC model. For instance, in the case of the Hancock and Martell, ECT, and ECW extensions of the EC model, the contributions of the steric, charge transfer, and constant energy factors (like dimer dissociation) are directly computed in the model.
- Comparisons of the difference between the energies calculated using ordinary EC parameters and the observed enthalpies has also been used as an estimate of the
- steric strain energy in strained adducts, which exhibit a less exothermic heat of adduct formation than expected
- \(\pi\)-backbonding energy in adducts which are capable of such interactions and exhibit a more exothermic heat of formation than expected.8-10
- For examples see (a) Drago, R. S., The interpretation of reactivity in chemical and biological systems with the E and C model. Coordination Chemistry Reviews 1980, 33 (3), 251-277; (b) Drago, R. S.; Bilgrien, C. J., Inductive transfer and coordination of ligands in metal—metal bonded systems. Polyhedron 1988, 7 (16), 1453-1468; (c) Drago, R. S., The question of a synergistic metal-metal interaction leading to .pi.-back-bond stabilization in dirhodium tetrabutyrate adducts. Inorganic Chemistry 1982, 21 (4), 1697-1698.
- The role of electrostatic, covalent, and other contributions to the spectroscopic behavior of Lewis acid-base complexes can be assessed similarly using specialized versions of the ECW or ECT model that allow for calculation of changes in spectroscopic parameters upon adduct formation - e.g., OH stretching frequencies. Details are beyond the scope of this text but may be found in the original literature,11 for example, Drago, R. S.; Vogel, G. C. JACS 1992, 114 (24), 9527-9532; Vogel, G. C.; Drago, R. S., J. Chem. Educ. 1996, 73 (8), 701; Drago, R. S.; Wong, N. M., J. Chem. Educ. 1996, 73 (2), 123.).
Pearson Softness Parameters have been proposed as a means of calculating the equilibrium constant for formation of a Lewis acid-base adduct, although they are more commonly used to estimate metal toxicity
Pearson also proposed a softness parameter that can be used to estimate the thermodynamics of Lewis acid-base complex formation, this time in the form of the equilibrium constant for
\[A + B \overset{K}{⇌} AB \nonumber \]
for which Pearson proposed
\[logK = S_AS_B + \sigma_A \sigma_B \nonumber \]
where SA and SB are acid and base parameters related to the strength of the acid-base interaction and \(\sigma_A\) and \(\sigma_B\) are acid and base parameters related to softness. This approach hasn't found as wide an acceptance in studies of chemical reactivity as the Drago-Wayland and absolute hardness parameters. However, because the toxicity of metal ions sometimes depends on their propensity to bind soft Lewis bases in living systems, the softness parameters which Pearson and Mawby subsequently proposed based on the relative energies of metal fluorine and metal iodine bonds12 have been widely used as a tool for predicting metal ion toxicity.13
References
1. Pearson, R. G., Absolute electronegativity and absolute hardness of Lewis acids and bases. Journal of the American Chemical Society 1985, 107 (24), 6801-6806.
2. Pearson, R. G., Absolute electronegativity and hardness: application to inorganic chemistry. Inorganic Chemistry 1988, 27 (4), 734-740.
3. Drago, R. S.; Wayland, B. B., A Double-Scale Equation for Correlating Enthalpies of Lewis Acid-Base Interactions. Journal of the American Chemical Society 1965, 87 (16), 3571-3577.
4. Vogel, G. C.; Drago, R. S., The ECW Model. Journal of Chemical Education 1996, 73 (8), 701.
5. Drago, R. S. A modern approach to acid-base chemistry. Journal of Chemical Education 1974, 51 (5), 300
6. Hancock, R. D.; Martell, A. E., Hard and Soft Acid-Base Behavior in Aqueous Solution: Steric Effects Make Some Metal Ions Hard: A Quantitative Scale of Hardness-Softness for Acids and Bases. Journal of Chemical Education 1996, 73 (7), 654.
7. Drago, R. S.; Wong, N. M., The Role of Electron-Density Transfer and Electronegativity in Understanding Chemical Reactivity and Bonding. Journal of Chemical Education 1996, 73 (2), 123.
8. Drago, R. S., The interpretation of reactivity in chemical and biological systems with the E and C model. Coordination Chemistry Reviews 1980, 33 (3), 251-277.
9. Drago, R. S.; Bilgrien, C. J., Inductive transfer and coordination of ligands in metal—metal bonded systems. Polyhedron 1988, 7 (16), 1453-1468.
10. Drago, R. S., The question of a synergistic metal-metal interaction leading to .pi.-back-bond stabilization in dirhodium tetrabutyrate adducts. Inorganic Chemistry 1982, 21 (4), 1697-1698.
11. Drago, R. S.; Vogel, G. C., Interpretation of spectroscopic changes upon adduct formation and their use to determine electrostatic and covalent (E and C) parameters. Journal of the American Chemical Society 1992, 114 (24), 9527-9532.
12. Pearson, R. G.; Mawby, R. J. The Nature of Metal-Halogen Bonds in Gutmann, V. Halogen Chemistry, vol. 3. Academic Press: London, 1967, pp. 55-84.
13. Kinraide, T. B. Improved Scales for Metal Ion Softness and Toxicity Environmental Toxicology and Chemistry 2009, 28 (3), 525-533.
Notes
* More precisely, the D parameters account for the difference in steric strain in the adduct relative to a water adduct of the Lewis acid.