
14.6: The Reaction Quotient- Predicting the Direction of Change
- Page ID
- 209370
- To predict in which direction a reaction will proceed.
We previously saw that knowing the magnitude of the equilibrium constant under a given set of conditions allows chemists to predict the extent of a reaction. Often, however, chemists must decide whether a system has reached equilibrium or if the composition of the mixture will continue to change with time. In this section, we describe how to quantitatively analyze the composition of a reaction mixture to make this determination.
The Reaction Quotient
To determine whether a system has reached equilibrium, chemists use a Quantity called the reaction Quotient (\(Q\)). The expression for the reaction Quotient has precisely the same form as the equilibrium constant expression, except that \(Q\) may be derived from a set of values measured at any time during the reaction of any mixture of the reactants and the products, regardless of whether the system is at equilibrium. Therefore, for the following general reaction:
\[aA+bB \rightleftharpoons cC+dD \nonumber \]
the reaction quotient is defined as follows:
\[Q=\dfrac{[C]^c[D]^d}{[A]^a[B]^b} \label{15.6.1} \]
To understand how information is obtained using a reaction Quotient, consider the dissociation of dinitrogen tetroxide to nitrogen dioxide,
\[\ce{N2O4(g) <=> 2NO2(g)} \nonumber \]
for which \(K = 4.65 \times 10^{−3}\) at 298 K. We can write \(Q\) for this reaction as follows:
\[Q=\dfrac{[\ce{NO2}]^2}{[\ce{N2O4}]} \label{15.6.2} \]
The following table lists data from three experiments in which samples of the reaction mixture were obtained and analyzed at equivalent time intervals, and the corresponding values of \(Q\) were calculated for each. Each experiment begins with different proportions of product and reactant:
| Experiment | \([\ce{NO2}]\; (M)\) | \([\ce{N2O4}]\; (M)\) | \(Q = \dfrac{[\ce{NO2}]^2}{[\ce{N2O4}]}\) |
|---|---|---|---|
| 1 | 0 | 0.0400 | \(\dfrac{0^2}{0.0400}=0\) |
| 2 | 0.0600 | 0 | \(\dfrac{(0.0600)^2}{0}=\text{undefined}\) |
| 3 | 0.0200 | 0.0600 | \(\dfrac{(0.0200)^2}{0.0600}=6.67 \times 10^{−3}\) |
As these calculations demonstrate, \(Q\) can have any numerical value between 0 and infinity (undefined); that is, \(Q\) can be greater than, less than, or equal to \(K\).
Comparing the magnitudes of \(Q\) and \(K\) enables us to determine whether a reaction mixture is already at equilibrium and, if it is not, predict how its composition will change with time to reach equilibrium (i.e., whether the reaction will proceed to the right or to the left as written). All you need to remember is that the composition of a system not at equilibrium will change in a way that makes \(Q\) approach \(K\):
- If \(Q = K\), for example, then the system is already at equilibrium, and no further change in the composition of the system will occur unless the conditions are changed.
- If \(Q < K\), then the ratio of the concentrations of products to the concentrations of reactants is less than the ratio at equilibrium. Therefore, the reaction will proceed to the right as written, forming products at the expense of reactants.
- If \(Q > K\), then the ratio of the concentrations of products to the concentrations of reactants is greater than at equilibrium, so the reaction will proceed to the left as written, forming reactants at the expense of products.
These points are illustrated graphically in Figure \(\PageIndex{1}\).
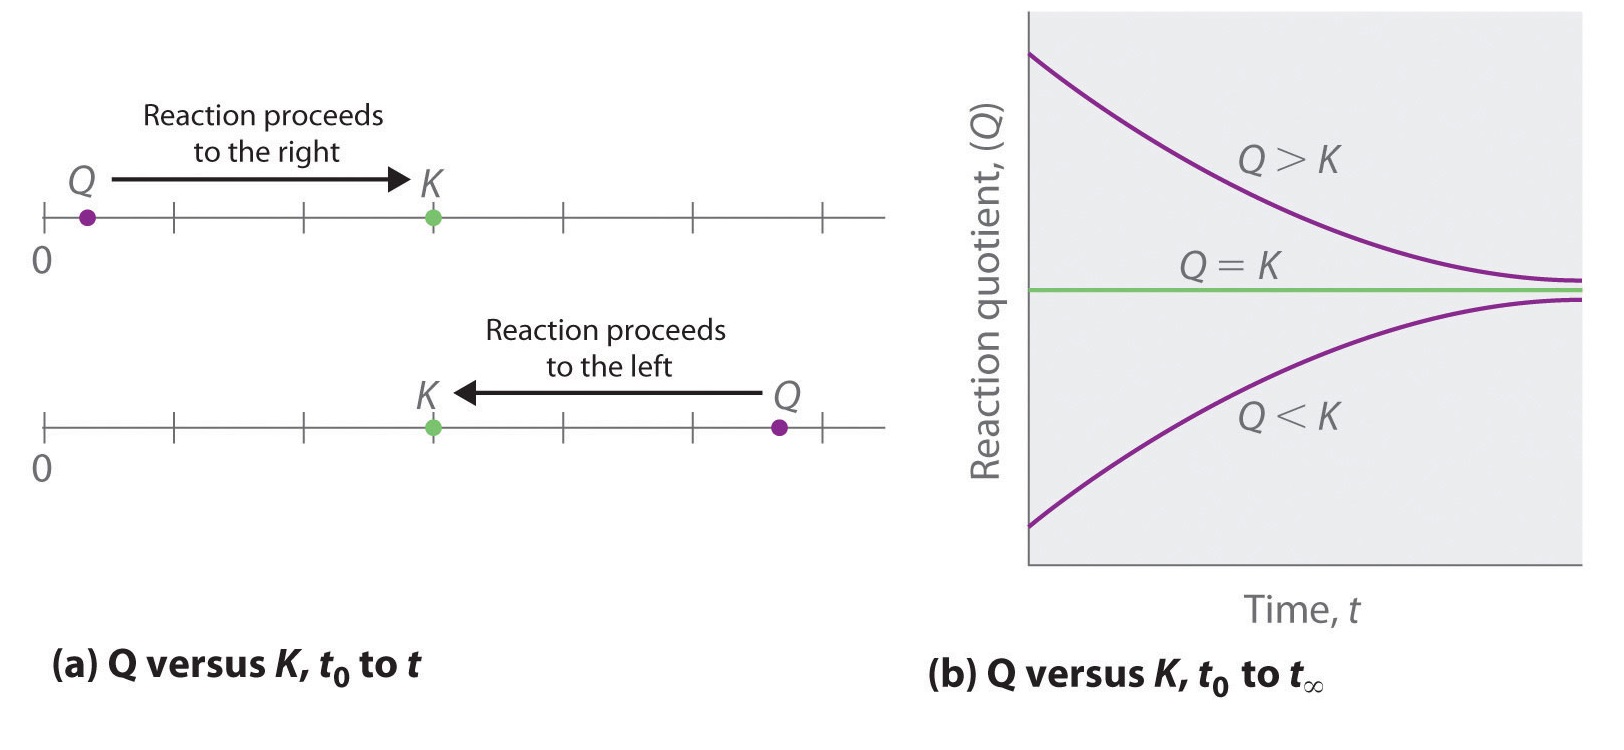
If \(Q < K\), the reaction will proceed to the right as written. If \(Q > K\), the reaction will proceed to the left as written. If \(Q = K\), then the system is at equilibrium.
A Video Discussing Using the Reaction Quotient (Q): Using the Reaction Quotient (Q) (opens in new window) [youtu.be]
At elevated temperatures, methane (\(CH_4\)) reacts with water to produce hydrogen and carbon monoxide in what is known as a steam-reforming reaction:
\[\ce{CH4(g) + H2O(g) <=> CO(g) + 3H2(g)} \nonumber \]
\(K = 2.4 \times 10^{−4}\) at 900 K. Huge amounts of hydrogen are produced from natural gas in this way and are then used for the industrial synthesis of ammonia. If \(1.2 \times 10^{−2}\) mol of \(CH_4\), 8.0 × 10⁻³ mol of \(H_2O\), \(1.6 \times 10^{−2}\) mol of \(CO\), and \(6.0 \times 10^{−3}\) mol of \(H_2\) are placed in a 2.0 L steel reactor and heated to 900 K, will the reaction be at equilibrium or will it proceed to the right to produce \(\ce{CO}\) and \(\ce{H_2}\) or to the left to form \(\ce{CH_4}\) and \(\ce{H_2O}\)?
Given: balanced chemical equation, \(K\), amounts of reactants and products, and volume
Asked for: direction of reaction
Strategy:
- Calculate the molar concentrations of the reactants and the products.
- Use Equation \(\ref{15.6.1}\) to determine \(Q\). Compare \(Q\) and \(K\) to determine in which direction the reaction will proceed.
Solution:
A We must first find the initial concentrations of the substances present. For example, we have \(1.2 \times 10^{−2} mol\) of \(\ce{CH_4}\) in a 2.0 L container, so
\[[\ce{CH4}]=\dfrac{1.2\times 10^{−2} \, \text{mol}}{2.0\; \text{L}}=6.0 \times 10^{−3} M \nonumber \]
We can calculate the other concentrations in a similar way:
- \([\ce{H2O}] = 4.0 \times 10^{−3} M\),
- \([\ce{CO}] = 8.0 \times 10^{−3} M\), and
- \([\ce{H_2}] = 3.0 \times 10^{−3} M\).
B We now compute \(Q\) and compare it with \(K\):
\[\begin{align*} Q&=\dfrac{[\ce{CO}][\ce{H_2}]^3}{[\ce{CH_4}][\ce{H_2O}]} \\[4pt] &=\dfrac{(8.0 \times 10^{−3})(3.0 \times 10^{−3})^3}{(6.0\times 10^{−3})(4.0 \times 10^{−3})} \\[4pt] &=9.0 \times 10^{−6} \end{align*} \nonumber \]
Because \(K = 2.4 \times 10^{−4}\), we see that \(Q < K\). Thus the ratio of the concentrations of products to the concentrations of reactants is less than the ratio for an equilibrium mixture. The reaction will therefore proceed to the right as written, forming \(\ce{H2}\) and \(\ce{CO}\) at the expense of \(\ce{H_2O}\) and \(\ce{CH4}\).
In the water–gas shift reaction introduced in Example \(\PageIndex{1}\), carbon monoxide produced by steam-reforming reaction of methane reacts with steam at elevated temperatures to produce more hydrogen:
\[\ce{CO(g) + H_2O(g) <=> CO2(g) + H2(g)} \nonumber \]
\(K = 0.64\) at 900 K. If 0.010 mol of both \(\ce{CO}\) and \(\ce{H_2O}\), 0.0080 mol of \(\ce{CO_2}\), and 0.012 mol of \(\ce{H_2}\) are injected into a 4.0 L reactor and heated to 900 K, will the reaction proceed to the left or to the right as written?
- Answer
-
\(Q = 0.96\). Since (Q > K), so the reaction will proceed to the left, and \(CO\) and \(H_2O\) will form.
Predicting the Direction of a Reaction with a Graph
By graphing a few equilibrium concentrations for a system at a given temperature and pressure, we can readily see the range of reactant and product concentrations that correspond to equilibrium conditions, for which \(Q = K\). Such a graph allows us to predict what will happen to a reaction when conditions change so that \(Q\) no longer equals \(K\), such as when a reactant concentration or a product concentration is increased or decreased.
Reaction 1
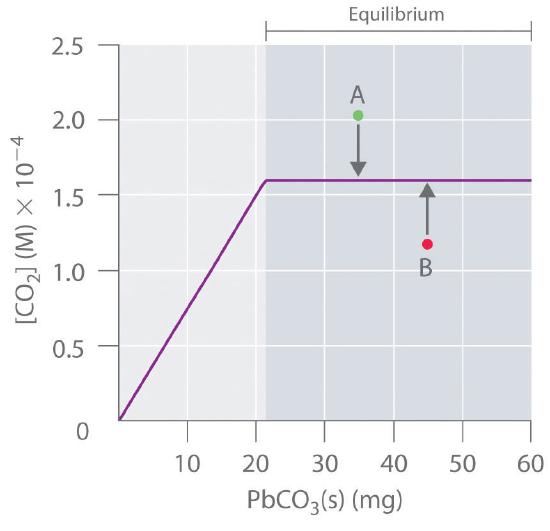
Lead carbonate decomposes to lead oxide and carbon dioxide according to the following equation:
\[\ce{PbCO3(s) <=> PbO(s) + CO2(g)} \label{15.6.3} \]
Because \(\ce{PbCO_3}\) and \(\ce{PbO}\) are solids, the equilibrium constant is simply
\[K = [\ce{CO_2}]. \nonumber \]
At a given temperature, therefore, any system that contains solid \(\ce{PbCO_3}\) and solid \(\ce{PbO}\) will have exactly the same concentration of \(\ce{CO_2}\) at equilibrium, regardless of the ratio or the amounts of the solids present. This situation is represented in Figure \(\PageIndex{3}\), which shows a plot of \([\ce{CO_2}]\) versus the amount of \(\ce{PbCO_3}\) added. Initially, the added \(\ce{PbCO_3}\) decomposes completely to \(\ce{CO_2}\) because the amount of \(\ce{PbCO_3}\) is not sufficient to give a \(\ce{CO_2}\) concentration equal to \(K\). Thus the left portion of the graph represents a system that is not at equilibrium because it contains only \(\ce{CO2(g)}\) and \(\ce{PbO(s)}\). In contrast, when just enough \(\ce{PbCO_3}\) has been added to give \([CO_2] = K\), the system has reached equilibrium, and adding more \(\ce{PbCO_3}\) has no effect on the \(\ce{CO_2}\) concentration: the graph is a horizontal line.
Thus any \(\ce{CO_2}\) concentration that is not on the horizontal line represents a nonequilibrium state, and the system will adjust its composition to achieve equilibrium, provided enough \(\ce{PbCO_3}\) and \(\ce{PbO}\) are present. For example, the point labeled A in Figure \(\PageIndex{2}\) lies above the horizontal line, so it corresponds to a \([\ce{CO_2}]\) that is greater than the equilibrium concentration of \(\ce{CO_2}\) (i.e., \(Q > K\)). To reach equilibrium, the system must decrease \([\ce{CO_2}]\), which it can do only by reacting \(\ce{CO_2}\) with solid \(\ce{PbO}\) to form solid \(\ce{PbCO_3}\). Thus the reaction in Equation \(\ref{15.6.3}\) will proceed to the left as written, until \([\ce{CO_2}] = K\). Conversely, the point labeled B in Figure \(\PageIndex{2}\) lies below the horizontal line, so it corresponds to a \([\ce{CO_2}]\) that is less than the equilibrium concentration of \(\ce{CO_2}\) (i.e., \(Q < K\)). To reach equilibrium, the system must increase \([\ce{CO_2}]\), which it can do only by decomposing solid \(\ce{PbCO_3}\) to form \(\ce{CO_2}\) and solid \(\ce{PbO}\). The reaction in Equation \ref{15.6.3} will therefore proceed to the right as written, until \([\ce{CO_2}] = K\).
Reaction 2
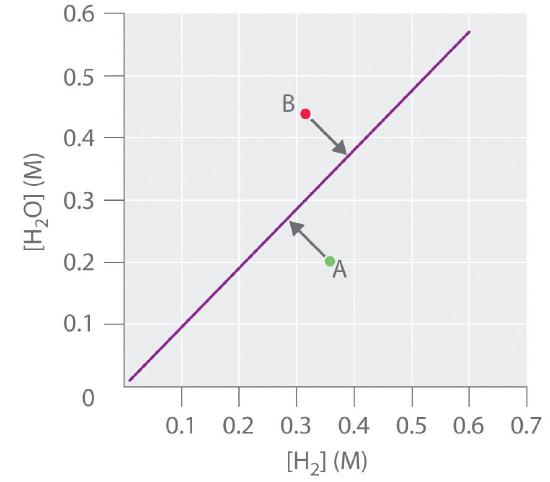
In contrast, the reduction of cadmium oxide by hydrogen gives metallic cadmium and water vapor:
\[\ce{CdO(s) + H2(g) <=> Cd(s) + H_2O(g)} \label{15.6.4} \]
and the equilibrium constant is
\[K = \dfrac{[\ce{H_2O}]}{[\ce{H_2}]}. \nonumber \]
If \([\ce{H_2O}]\) is doubled at equilibrium, then \([\ce{H2}]\) must also be doubled for the system to remain at equilibrium. A plot of \([\ce{H_2O}]\) versus \([\ce{H_2}]\) at equilibrium is a straight line with a slope of \(K\) (Figure \(\PageIndex{3}\)). Again, only those pairs of concentrations of \(\ce{H_2O}\) and \(\ce{H_2}\) that lie on the line correspond to equilibrium states. Any point representing a pair of concentrations that does not lie on the line corresponds to a nonequilibrium state. In such cases, the reaction in Equation \(\ref{15.6.4}\) will proceed in whichever direction causes the composition of the system to move toward the equilibrium line. For example, point A in Figure \(\PageIndex{3}\) lies below the line, indicating that the \([\ce{H_2O}]/[\ce{H_2}]\) ratio is less than the ratio of an equilibrium mixture (i.e., \(Q < K\)). Thus the reaction in Equation \ref{15.6.4} will proceed to the right as written, consuming \(\ce{H_2}\) and producing \(\ce{H_2O}\), which causes the concentration ratio to move up and to the left toward the equilibrium line. Conversely, point B in Figure \(\PageIndex{3}\) lies above the line, indicating that the \([\ce{H_2O}]/[\ce{H_2}]\) ratio is greater than the ratio of an equilibrium mixture (\(Q > K\)). Thus the reaction in Equation \(\ref{15.6.4}\) will proceed to the left as written, consuming \(\ce{H_2O}\) and producing \(\ce{H_2}\), which causes the concentration ratio to move down and to the right toward the equilibrium line.
Reaction 3
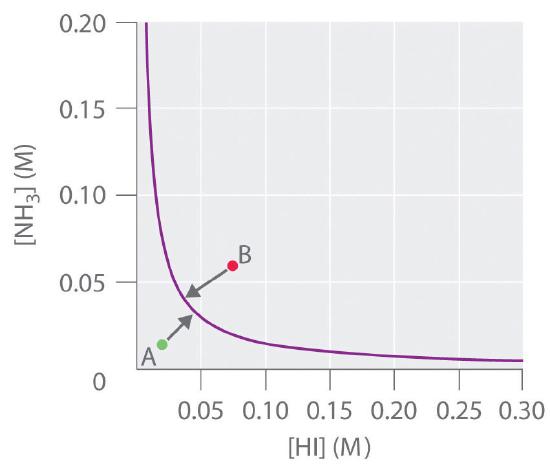
In another example, solid ammonium iodide dissociates to gaseous ammonia and hydrogen iodide at elevated temperatures:
\[\ce{ NH4I(s) <=> NH3(g) + HI(g)} \label{15.6.5} \]
For this system, \(K\) is equal to the product of the concentrations of the two products:
\[K = [\ce{NH_3}][\ce{HI}]. \nonumber \]
If we double the concentration of \(\ce{NH3}\), the concentration of \(\ce{HI}\) must decrease by approximately a factor of 2 to maintain equilibrium, as shown in Figure \(\PageIndex{4}\). As a result, for a given concentration of either \(\ce{HI}\) or \(\ce{NH_3}\), only a single equilibrium composition that contains equal concentrations of both \(\ce{NH_3}\) and \(\ce{HI}\) is possible, for which
\[[\ce{NH_3}] = [\ce{HI}] = \sqrt{K}. \nonumber \]
Any point that lies below and to the left of the equilibrium curve (such as point A in Figure \(\PageIndex{4}\)) corresponds to \(Q < K\), and the reaction in Equation \(\ref{15.6.5}\) will therefore proceed to the right as written, causing the composition of the system to move toward the equilibrium line. Conversely, any point that lies above and to the right of the equilibrium curve (such as point B in Figure \(\ref{15.6.5}\)) corresponds to \(Q > K\), and the reaction in Equation \(\ref{15.6.5}\) will therefore proceed to the left as written, again causing the composition of the system to move toward the equilibrium line. By graphing equilibrium concentrations for a given system at a given temperature and pressure, we can predict the direction of reaction of that mixture when the system is not at equilibrium.
Summary
The reaction Quotient (\(Q\)) is used to determine whether a system is at equilibrium and if it is not, to predict the direction of reaction. The reaction Quotient (\(Q\) or \(Q_p\)) has the same form as the equilibrium constant expression, but it is derived from concentrations obtained at any time. When a reaction system is at equilibrium, \(Q = K\). Graphs derived by plotting a few equilibrium concentrations for a system at a given temperature and pressure can be used to predict the direction in which a reaction will proceed. Points that do not lie on the line or curve represent nonequilibrium states, and the system will adjust, if it can, to achieve equilibrium.